
Page 23 - Fall 2023 inLEAGUE with Historic Theatre Resource Guide/Allied Member Directory
P. 23
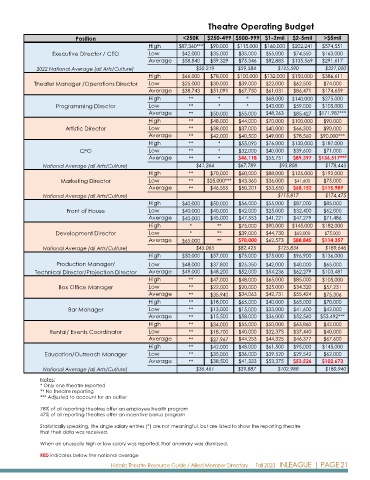
Theatre Operating Budget

                          Position                            <250K   $250-499 $500-999 $1-2mil   $2-5mil   >$5mil
                                                  High      $87,360***  $90,000  $115,000  $160,000  $202,241  $574,551
                  Executive Director / CEO        Low        $42,000   $35,000  $35,000  $55,000  $74,550   $163,000
                                                  Average    $58,840   $59,329  $75,346  $82,883  $135,569  $291,617
             2022 National Average (all Arts/Culture)             $50,219       $59,584      $125,590        $327,000
                                                  High       $66,000   $78,000  $100,000  $132,000  $150,000  $386,611
            Theater Manager /Operations Director  Low        $25,000   $30,000  $39,000  $22,000  $62,500   $74,000
                                                  Average    $38,743   $51,091  $67,750  $61,031  $86,471   $174,659
                                                  High         **        *         *     $68,000  $140,000  $275,000
                    Programming Director          Low          **        *         *     $43,000  $59,000   $105,000
                                                  Average      **      $50,000  $55,000  $48,263  $85,427  $171,987***
                                                  High         **      $48,000  $44,000  $70,000  $100,000  $90,000
                       Artistic Director          Low          **      $38,000  $37,000  $40,000  $66,300   $90,000
                                                  Average      **      $42,000  $40,500  $49,000  $78,560  $90,000***
                                                  High         **        *      $55,090  $76,000  $130,000  $187,000
                           CFO                    Low          **        *      $32,000  $40,000  $39,600   $71,000
                                                  Average      **        *      $46,118  $55,751  $89,397  $136,517***
               National Average (all Arts/Culture)                $41,264       $67,789      $93,808         $178,443
                                                  High         **      $70,000  $60,000  $88,000  $125,000  $192,000
                     Marketing Director           Low          **    $25,000***  $43,360  $36,000  $41,600  $75,000
                                                  Average      **      $46,555  $50,201  $53,650  $68,152  $115,989
               National Average (all Arts/Culture)                                           $115,817        $174,475
                                                  High       $40,000   $50,000  $56,000  $55,000  $87,000   $85,000
                       Front of House             Low        $40,000   $40,000  $42,000  $25,000  $32,400   $62,000
                                                  Average    $40,000   $45,000  $47,553  $41,221  $47,279   $71,486
                                                  High          *        **     $75,000  $90,000  $145,000  $182,000
                   Development Director           Low           *        **     $39,000  $44,730  $62,000   $75,000
                                                  Average    $65,000     **     $70,000  $62,573  $88,845  $114,357
               National Average (all Arts/Culture)                $45,065       $82,425      $125,834        $189,646
                                                  High       $50,000   $57,000  $75,000  $75,000  $96,900   $136,000
                    Production Manager/           Low        $48,000   $37,800  $25,350  $42,000  $40,000   $65,000
             Technical Director/Projection Director  Average  $49,000  $48,200  $52,000  $54,236  $62,279   $103,481
                                                  High         **      $47,000  $48,000  $65,000  $85,000   $105,000
                    Box Office Manager            Low          **      $22,000  $20,000  $25,000  $34,320   $57,231
                                                  Average      **      $35,940  $34,063  $42,731  $55,424   $75,306
                                                  High         **      $18,000  $65,000  $40,000  $65,000   $70,000
                        Bar Manager               Low          **      $13,000  $15,000  $33,000  $41,600   $42,000
                                                  Average      **      $15,500  $58,000  $36,000  $52,560  $53,492***
                                                  High         **      $34,000  $55,000  $50,000  $63,860   $42,000
                 Rental/ Events Coordinator       Low          **      $18,700  $40,000  $32,375  $37,440   $40,000
                                                  Average      **      $27,967  $44,253  $44,325  $46,377   $67,600
                                                  High         **      $42,000  $48,000  $61,500  $95,000   $145,000
                Education/Outreach Manager        Low          **      $35,000  $36,000  $39,520  $29,542   $62,000
                                                  Average      **      $38,500  $41,333  $53,375  $53,526  $102,673
               National Average (all Arts/Culture)                $36,461       $39,887      $102,988        $180,940
              Notes:
              * Only one theatre reported
              ** No theatre reporting
              *** Adjusted to account for an outlier

              78% of all reporting theatres offer an employee health program
              47% of all reporting theatres offer an incentive bonus program
              Statistically speaking, the single salary entries (*) are not meaningful, but are listed to show the reporting theatre
              that their data was received.

              When an unusually high or low salary was reported, that anomaly was dismissed.
              RED indicates below the national average
                                      Historic Theatre Resource Guide / Allied Member Directory      Fall 2023   INLEAGUE  | PAGE 21