
Page 22 - Fall 2023 inLEAGUE with Historic Theatre Resource Guide/Allied Member Directory
P. 22
The 2023 LHAT Historic Theatre Salary Survey includes salary information as reported by
member theatres. These numbers have not been adjusted for geographic location
and, therefore, should be used only as a guide when budgeting and/or negotiating
salaries. Value from bonuses and/or other benefits is not included.
Every theatre is different and staffing differs greatly from theatre to theatre. We have
provided salary numbers for those staff positions which were common to most theatres.
If you are interested in a report more specific to your theatre, email kstein@lhat.org to
see if we can refine the parameters for your specific location.
DEFINITIONS:
HIGH – this number represents the highest salary provided from participating
theatres. Often this number was reported by a theatre in a large community.
LOW – this number reflects the lowest salary provided from participating theatres.
Often this number was reported by a theatre in a small community. Note: Outliers
were removed from the report.
AVERAGE – this number represents the average salary of all salaries collected
from similar size theatres. This number is not adjusted for geographic location
and therefore represents a national average that might need to be adjusted for
metropolitan areas with higher cost of living requirements.
The National Average (where provided) represents all arts and culture nonprofits
and not just historic theatres.
17%
12% 4%
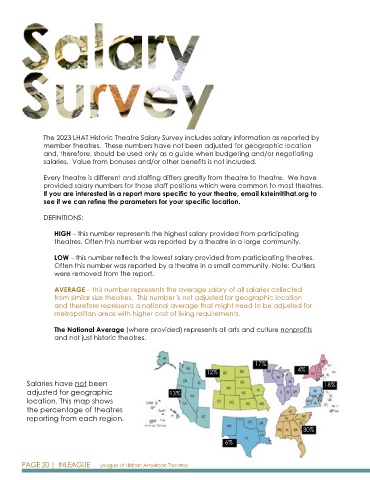
Salaries have not been 18%
adjusted for geographic 13%
location. This map shows
the percentage of theatres
reporting from each region.
30%
6%
PAGE 20 | INLEAGUE League of Historic American Theatres