
Page 80 - draft
P. 80
Net
Beginning Income/(Net
Fund Description Balance Revenues Expenditures Deficit) Ending Balance
Operating Funds
10 Education 22,871,534 48,058,808 (34,249,595) 13,809,213 36,680,747
20 Operations/Maintenance 4,488,319 3,770,440 (3,706,103) 64,337 4,552,655
40 Transportation 4,828,628 4,253,887 (932,848) 3,321,039 8,149,667
50 IMRF - FICA/Medicare 3,511,444 2,337,361 (1,187,887) 1,149,474 4,660,919
70 Working Cash 4,598,084 292,830 - 292,830 4,890,914
Total Operating Funds 40,298,009 58,713,325 (40,076,432) 18,636,893 58,934,902
Non-Operating Funds
30 Debt Service 6,077,946 3,921,077 (7,088,722) (3,167,645) 2,910,301
60 Capital Projects 106,544,704 37,450 (11,313,068) (11,275,618) 95,269,085
80 Tort 1,847,650 1,471,935 (1,397,628) 74,306 1,921,956
90 Life Safety 3,468,683 370,798 - 370,798 3,839,481
Total Non-Operating Funds 117,938,982 5,801,260 (19,799,418) (13,998,159) 103,940,823
Grand Total 158,236,991 64,514,585 (59,875,850) 4,638,735 162,875,726
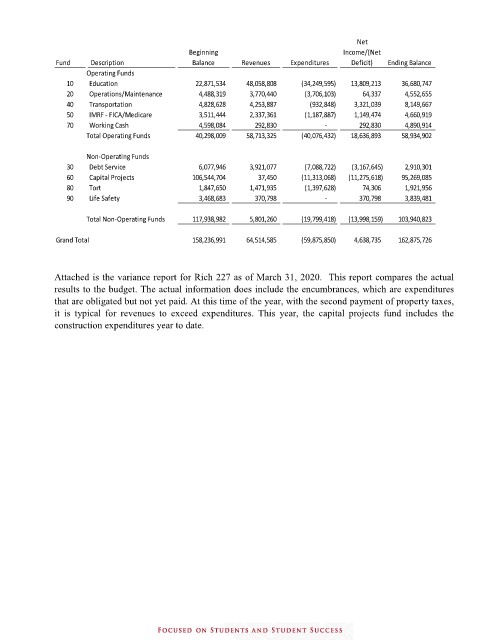
Attached is the variance report for Rich 227 as of March 31, 2020. This report compares the actual
results to the budget. The actual information does include the encumbrances, which are expenditures
that are obligated but not yet paid. At this time of the year, with the second payment of property taxes,
it is typical for revenues to exceed expenditures. This year, the capital projects fund includes the
construction expenditures year to date.