Page 4 - 8th Grade EOG Prep ans key
P. 4

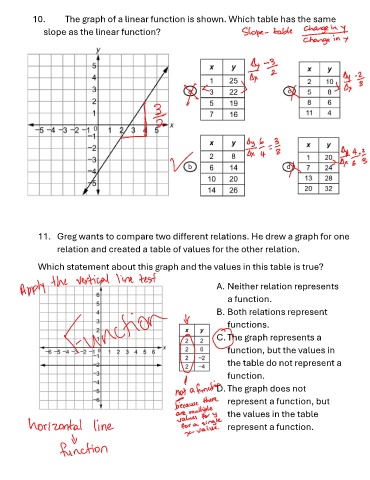
10.        The graph of a linear function is shown. Which table has the same
               slope as the linear function?


              11.  Greg wants to compare two different relations. He drew a graph for one
                    relation and created a table of values for the other relation.


              Which statement about this graph and the values in this table is true?


                                                                         A. Neither relation represents
                                                                            a function.

                                                                         B. Both relations represent

                                                                            functions.
                                                                         C. The graph represents a

                                                                            function, but the values in

                                                                            the table do not represent a
                                                                            function.

                                                                         D. The graph does not

                                                                            represent a function, but

                                                                            the values in the table

                                                                            represent a function.
   1   2   3   4   5   6   7   8   9