
Page 5 - 8th Grade EOG Prep ans key
P. 5
Name: __________________________________________________________ Review 2
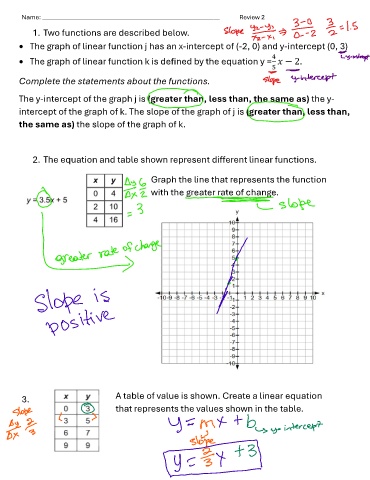
1. Two functions are described below.
• The graph of linear function j has an x-intercept of (-2, 0) and y-intercept (0, 3)
4
• The graph of linear function k is defined by the equation y = − 2.
5
Complete the statements about the functions.
The y-intercept of the graph j is (greater than, less than, the same as) the y-
intercept of the graph of k. The slope of the graph of j is (greater than, less than,
the same as) the slope of the graph of k.
2. The equation and table shown represent different linear functions.
Graph the line that represents the function
with the greater rate of change.
3. A table of value is shown. Create a linear equation
that represents the values shown in the table.