
Page 8 - 8th Grade EOG Prep ans key
P. 8
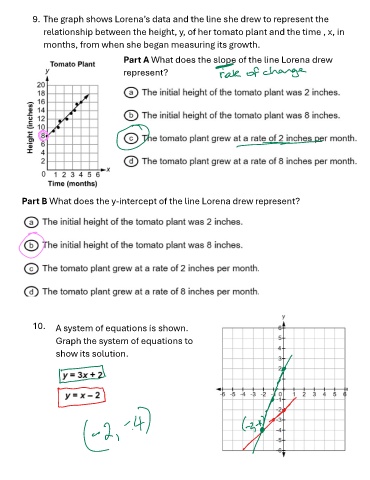
9. The graph shows Lorena’s data and the line she drew to represent the
               relationship between the height, y, of her tomato plant and the time , x, in

               months, from when she began measuring its growth.

                                          Part A What does the slope of the line Lorena drew

                                          represent?


        Part B What does the y-intercept of the line Lorena drew represent?


            10.    A system of equations is shown.

                   Graph the system of equations to

                   show its solution.