
Page 6 - 8th Grade EOG Prep ans key
P. 6
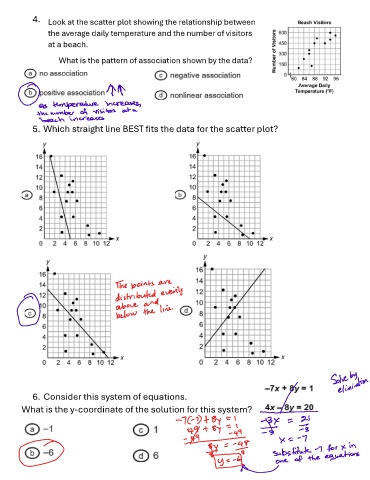
4.    Look at the scatter plot showing the relationship between

                 the average daily temperature and the number of visitors
                 at a beach.

                    What is the pattern of association shown by the data?


            5. Which straight line BEST fits the data for the scatter plot?


            6. Consider this system of equations.
        What is the y-coordinate of the solution for this system?