
Page 705 - Accounting Principles (A Business Perspective)
P. 705
17. Analysis and interpretation of financial statements
• Market tests help investors and potential investors assess the relative merits of the various stocks in the
marketplace. These tests include (1) earnings yield on common stock, (2) price-earnings ratio, (3) dividend
yield on common stock, (4) payout ratio on common stock, (5) dividend yield on preferred stock, and (6) cash
flow per share of common stock.
• For a complete summary and a graphic depiction of all liquidity, long-term solvency, profitability, and
market test ratios, see Exhibit 135 and Exhibit 136.
• Need for comparative data: Analysts must be sure that their comparisons are valid—especially when
the comparisons are of items for different periods or different companies.
• Influence of external factors: A single important event, such as the unexpected placing of a product on
the market by a competitor, may affect the interpretation of the financial statements. Also, the general
business conditions and the possible seasonal nature of the business must be taken into consideration, since
these factors could have an impact on the financial statements.
• Impact of inflation: Since financial statements fail to reveal the impact of inflation on the reporting
entity, one must make sure that the items being compared are all comparable; that is, the impact of inflation
has been taken into consideration.
• Need for comparative standards: In financial statement analysis, remember that standards for
comparison vary by industry, and financial analysis must be carried out with knowledge of specific industry
characteristics.
Demonstration problem
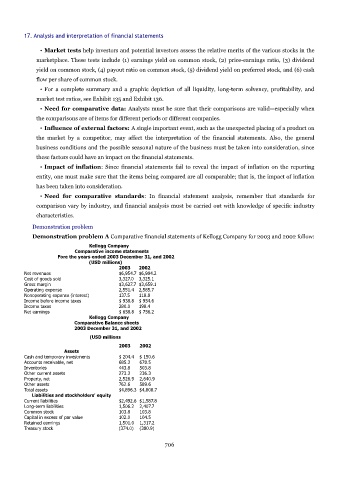
Demonstration problem A Comparative financial statements of Kellogg Company for 2003 and 2002 follow:
Kellogg Company
Comparative income statements
Fore the years ended 2003 December 31, and 2002
(USD millions)
2003 2002
Net revenues $6,954.7 $6,984.2
Cost of goods sold 3,327.0 3,325.1
Gross margin $3,627.7 $3,659.1
Operating expense 2,551.4 2,585.7
Nonoperating expense (interest) 137.5 118.8
Income before income taxes $ 938.8 $ 954.6
Income taxes 280.0 198.4
Net earnings $ 658.8 $ 756.2
Kellogg Company
Comparative Balance sheets
2003 December 31, and 2002
(USD millions
2003 2002
Assets
Cash and temporary investments $ 204.4 $ 150.6
Accounts receivable, net 685.3 678.5
Inventories 443.8 503.8
Other current assets 273.3 236.3
Property, net 2,526.9 2,640.9
Other assets 762.6 589.6
Total assets $4,896.3 $4,808.7
Liabilities and stockholders' equity
Current liabilities $2,492.6 $1,587.8
Long-term liabilities 1,506.2 2,407.7
Common stock 103.8 103.8
Capital in excess of par value 102.0 104.5
Retained earnings 1,501.0 1,317.2
Treasury stock (374.0) (380.9)
706