
Page 707 - Accounting Principles (A Business Perspective)
P. 707
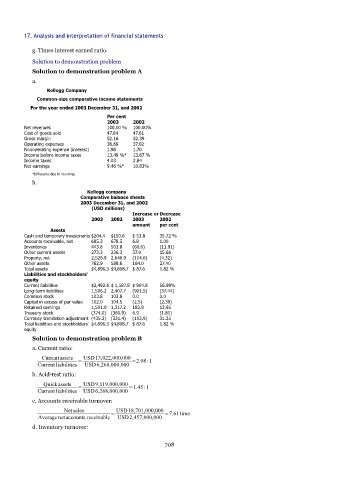
17. Analysis and interpretation of financial statements

            g. Times interest earned ratio.

            Solution to demonstration problem
            Solution to demonstration problem A
            a.
                  Kellogg Company
              Common-size comparative income statements
            For the year ended 2003 December 31, and 2002
                                       Per cent
                                       2003     2002
          Net revenues                 100.00 %  100.00%
          Cost of goods sold           47.84    47.61
          Gross margin                 52.16    52.39
          Operating expenses           36.69    37.02
          Nonoperating expense (interest)  1.98  1.70
          Income before income taxes   13.49 %*  13.67 %
          Income taxes                 4.03     2.84
          Net earnings                 9.46 %*  10.83%
            *Difference due to rounding.
            b.
                                Kellogg company
                             Comparative balance sheets
                             2003 December 31, and 2002
                                 (USD millions)
                                                Increase or Decrease
                                 2003   2002    2003     2002
                                                amount   per cent
                   Assets
          Cash and temporary investments $204.4  $150.6  $ 53.8  35.72 %
          Accounts receivable, net  685.3  678.5  6.8    1.00
          Inventories            443.8  503.8   (60.0)   (11.91)
          Other current assets   273.3  236.3   37.0     15.66
          Property, net          2,526.9 2,640.9  (114.0)  (4.32)
          Other assets           762.9  589.6   164.0    27.40
          Total assets           $4,896.3 $4,808.7 $ 87.6  1.82 %
          Liabilities and stockholders'
          equity
          Current liabilities    $2,492.6 $ 1,587.8 $ 904.8  56.98%
          Long-term liabilities  1,506.2 2,407.7  (901.5)  (37.44)
          Common stock           103.8  103.8   0.0      0.0
          Capital in excess of par value  102.0  104.5  (2.5)  (2.39)
          Retained earnings      1,501.0 1,317.2  183.8  13.95
          Treasury stock         (374.0)  (380.9)  6.9   (1.81)
          Currency translation adjustment (435.3)  (331.4)  (103.9)  31.35
          Total liabilities and stockholders'  $4,896.3 $4,808.7 $ 87.6  1.82 %
          equity
            Solution to demonstration problem B
            a. Current ratio:
                Currentassets  USD13,022,000,000  =2.08:1
              Current liabilities  =  USD6,268,000,000
            b. Acid-test ratio:

                Quickassets   USD9,119,000,000 =1.45:1
              Current liabilities  =  USD6,268,000,000
            c. Accounts receivable turnover:
                        Netsales          USD18,701,000,000
              Average netaccounts receivable =  USD2,457,000,000  =7.61time
            d. Inventory turnover:


                                                           708