
Page 10 - FIN435 RHB vs BPMB
P. 10
The capital adequacy ratio (CAR) is a measurement of a bank's available capital expressed
as a percentage of a bank's risk-weighted credit exposures. t. Based on the graph the trend
goes upward from the year 2016 to 2018. It’s from 17.41% then 17.50% and last 2018 is
19.21%. the conclusion is the higher the capital adequacy ration the greater the level of
unexpected loses it can absorb before becoming insolvent.
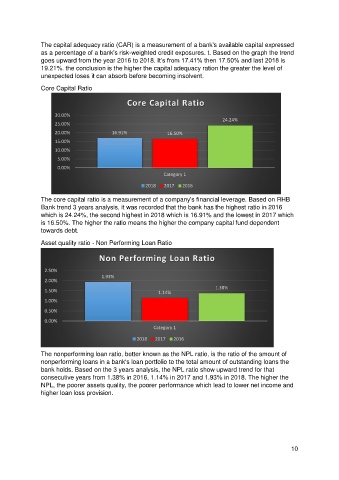
Core Capital Ratio
Core Capital Ratio
30.00%
24.24%
25.00%
20.00% 16.91% 16.50%
15.00%
10.00%
5.00%
0.00%
Category 1
2018 2017 2016
The core capital ratio is a measurement of a company's financial leverage. Based on RHB
Bank trend 3 years analysis, it was recorded that the bank has the highest ratio in 2016
which is 24.24%, the second highest in 2018 which is 16.91% and the lowest in 2017 which
is 16.50%. The higher the ratio means the higher the company capital fund dependent
towards debt.
Asset quality ratio - Non Performing Loan Ratio
Non Performing Loan Ratio
2.50%
1.93%
2.00%
1.38%
1.50% 1.14%
1.00%
0.50%
0.00%
Category 1
2018 2017 2016
The nonperforming loan ratio, better known as the NPL ratio, is the ratio of the amount of
nonperforming loans in a bank's loan portfolio to the total amount of outstanding loans the
bank holds. Based on the 3 years analysis, the NPL ratio show upward trend for that
consecutive years from 1.38% in 2016, 1.14% in 2017 and 1.93% in 2018. The higher the
NPL, the poorer assets quality, the poorer performance which lead to lower net income and
higher loan loss provision.
10