
Page 5 - FIN435 RHB vs BPMB
P. 5
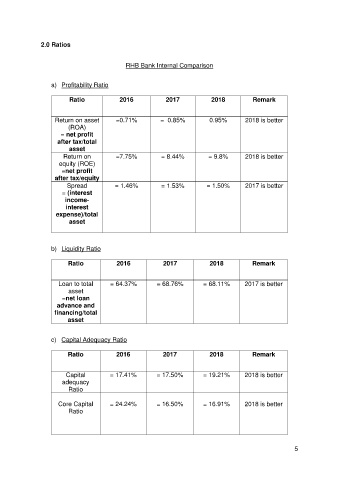
2.0 Ratios


                                             RHB Bank Internal Comparison


                   a)  Profitability Ratio

                         Ratio             2016            2017            2018           Remark


                    Return on asset       =0.71%         =  0.85%          0.95%       2018 is better
                         (ROA)
                      = net profit
                     after tax/total
                         asset
                       Return on          =7.75%          = 8.44%         = 9.8%       2018 is better
                      equity (ROE)
                       =net profit
                    after tax/equity
                         Spread          = 1.46%          = 1.53%         = 1.50%      2017 is better
                       = (interest
                        income-
                        interest
                     expense)/total
                         asset


                   b)  Liquidity Ratio

                         Ratio            2016            2017             2018           Remark


                      Loan to total     = 64.37%        = 68.76%        = 68.11%       2017 is better
                         asset
                       =net loan
                     advance and
                    financing/total
                         asset


                   c)  Capital Adequacy Ratio

                         Ratio            2016            2017             2018           Remark


                        Capital         = 17.41%        = 17.50%        = 19.21%       2018 is better
                       adequacy
                         Ratio

                     Core Capital       = 24.24%        = 16.50%        = 16.91%       2018 is better
                         Ratio


                                                                                                        5