
Page 9 - FIN435 RHB vs BPMB
P. 9
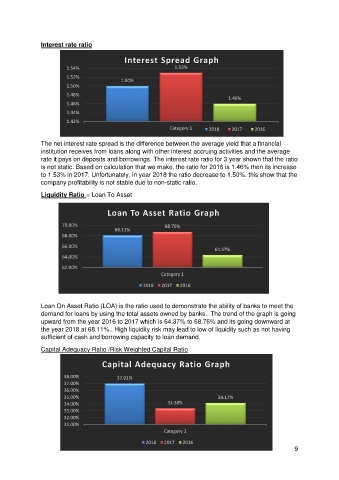
Interest rate ratio


                                             Interest Spread Graph
                        1.54%                                 1.53%
                        1.52%
                                            1.50%
                        1.50%
                        1.48%
                                                                                 1.46%
                        1.46%
                        1.44%

                        1.42%
                                                             Category 1   2018    2017    2016

               The net interest rate spread is the difference between the average yield that a financial
               institution receives from loans along with other interest accruing activities and the average
               rate it pays on deposits and borrowings. The interest rate ratio for 3 year shown that the ratio
               is not static. Based on calculation that we make, the ratio for 2016 is 1.46% then its increase
               to 1.53% in 2017. Unfortunately, in year 2018 the ratio decrease to 1.50%. this show that the
               company profitability is not stable due to non-static ratio.

               Liquidity Ratio = Loan To Asset


                                       Loan To Asset Ratio Graph

                       70.00%                              68.76%
                                         68.11%
                       68.00%
                       66.00%
                                                                            64.37%
                       64.00%
                       62.00%
                                                          Category 1

                                                   2018   2017  2016

               Loan On Asset Ratio (LOA) is the ratio used to demonstrate the ability of banks to meet the
               demand for loans by using the total assets owned by banks.. The trend of the graph is going
               upward from the year 2016 to 2017 which is 64.37% to 68.76% and its going downward at
               the year 2018 at 68.11%.. High liquidity risk may lead to low of liquidity such as not having
               sufficient of cash and borrowing capacity to loan demand.

               Capital Adequacy Ratio /Risk Weighted Capital Ratio
                                     Capital Adequacy Ratio Graph

                       38.00%             37.01%

                       37.00%
                       36.00%
                       35.00%                                                 34.17%
                       34.00%                               33.38%
                       33.00%
                       32.00%
                       31.00%
                                                           Category 1
                                                    2018   2017  2016
                                                                                                        9