
Page 9 - FIN435 RHB vs BPMB
P. 9
2.3 RHB INTERNAL AND EXTERNAL COMMENT EVALUATION
PROFITABILITY RATIO
Return On Assets
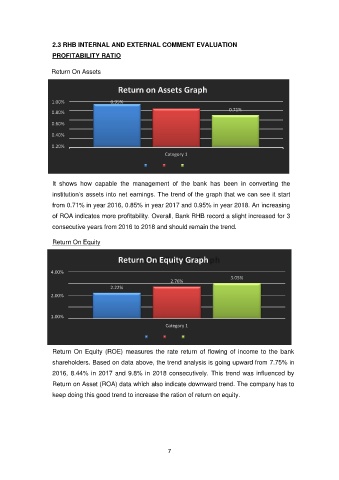
Return on Assets Graph
1.00% 0.95%
0.71%
0.80% 0.85%
0.60%
0.40%
0.20%
Category 1
0.00%
2018 2017 2016
It shows how capable the management of the bank has been in converting the
institution’s assets into net earnings. The trend of the graph that we can see it start
from 0.71% in year 2016, 0.85% in year 2017 and 0.95% in year 2018. An increasing
of ROA indicates more profitability. Overall, Bank RHB record a slight increased for 3
consecutive years from 2016 to 2018 and should remain the trend.
Return On Equity
Return On Equity Graph
4.00%
3.05%
2.76%
2.22%
3.00%
2.00%
1.00%
Category 1
0.00%
2018 2017 2016
Return On Equity (ROE) measures the rate return of flowing of income to the bank
shareholders. Based on data above, the trend analysis is going upward from 7.75% in
2016, 8.44% in 2017 and 9.8% in 2018 consecutively. This trend was influenced by
Return on Asset (ROA) data which also indicate downward trend. The company has to
keep doing this good trend to increase the ration of return on equity.
7