
Page 12 - FIN435 RHB vs BPMB
P. 12
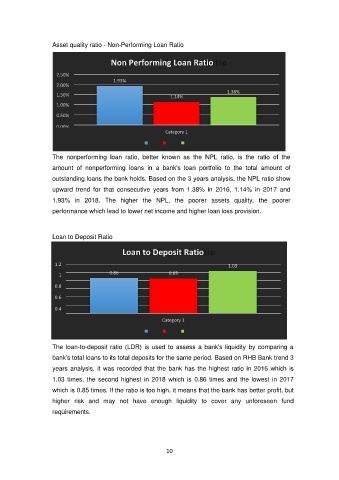
Asset quality ratio - Non-Performing Loan Ratio


                                        Non Performing Loan Ratio

                     2.50%
                                         1.93%
                     2.00%
                                                                                 1.38%
                     1.50%                                   1.14%
                     1.00%

                     0.50%
                     0.00%
                                                           Category 1


                                                     2018   2017   2016
                   The  nonperforming  loan  ratio,  better  known  as  the  NPL  ratio,  is  the  ratio  of  the
                   amount  of  nonperforming  loans  in  a  bank's  loan  portfolio  to  the  total  amount  of
                   outstanding loans the bank holds. Based on the 3 years analysis, the NPL ratio show

                   upward  trend  for  that  consecutive  years  from  1.38%  in  2016,  1.14%  in  2017  and
                   1.93%  in  2018.  The  higher  the  NPL,  the  poorer  assets  quality,  the  poorer

                   performance which lead to lower net income and higher loan loss provision.


                   Loan to Deposit Ratio

                                            Loan to Deposit Ratio


                    1.2                                                          1.03
                      1                0.86                 0.85
                    0.8

                    0.6
                    0.4

                    0.2                                   Category 1
                      0
                                                     2018   2017   2016
                   The  loan-to-deposit  ratio  (LDR)  is  used  to  assess  a  bank's  liquidity  by  comparing  a

                   bank's total loans to its total deposits for the same period. Based on RHB Bank trend 3
                   years analysis, it was recorded that the bank has the highest ratio in 2016 which is
                   1.03  times,  the  second  highest  in  2018  which  is  0.86  times  and  the  lowest  in  2017

                   which is 0.85 times. If the ratio is too high, it means that the bank has better profit, but
                   higher  risk  and  may  not  have  enough  liquidity  to  cover  any  unforeseen  fund

                   requirements.


                                                           10