Page 17 - FIN435 RHB vs BPMB
P. 17

2.7 BANK PEMBANGUNAN MALAYSIA BERHAD RATIO INTERNAL COMPARISON

                       1.  Profitability Ratio
                                                    Return On Assets (ROA):

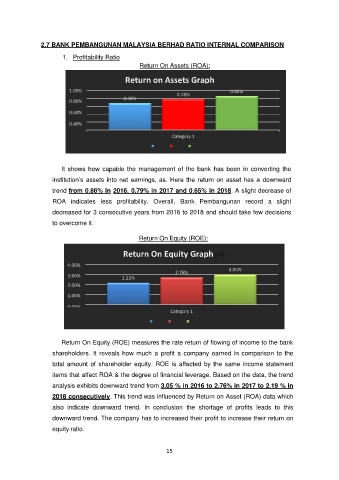
                                             Return on Assets Graph
                         1.00%                                                    0.86%
                                                               0.78%
                                            0.68%
                         0.80%
                         0.60%

                         0.40%
                         0.20%                               Category 1

                         0.00%

                                                        2018   2017   2016
                       It  shows  how  capable  the  management  of  the  bank  has  been  in  converting  the

                   institution’s assets into net earnings, as. Here the return on asset has a downward
                   trend from 0.86% in 2016, 0.79% in 2017 and 0.65% in 2018. A slight decrease of
                   ROA  indicates  less  profitability.  Overall,  Bank  Pembangunan  record  a  slight

                   decreased for 3 consecutive years from 2016 to 2018 and should take few decisions
                   to overcome it.


                                                  Return On Equity (ROE):

                                            Return On Equity Graph

                         4.00%
                                                                                 3.05%
                                                               2.76%
                         3.00%
                                            2.22%
                         2.00%
                         1.00%

                         0.00%
                                                             Category 1

                                                       2018   2017   2016
                       Return On Equity (ROE) measures the rate return of flowing of income to the bank

                   shareholders.  It  reveals how  much  a  profit  a  company  earned  in  comparison  to the
                   total  amount  of  shareholder  equity.  ROE  is  affected  by the  same  income  statement
                   items that affect ROA & the degree of financial leverage. Based on the data, the trend

                   analysis exhibits downward trend from 3.05 % in 2016 to 2.76% in 2017 to 2.19 % in
                   2018 consecutively. This trend was influenced by Return on Asset (ROA) data which
                   also  indicate  downward  trend.  In  conclusion  the  shortage  of  profits  leads  to  this

                   downward trend. The company has to increased their profit to increase their return on
                   equity ratio.


                                                           15
   12   13   14   15   16   17   18   19   20   21   22