
Page 256 - Atlas of Small Animal CT and MRI
P. 256
246 Atlas of Small Animal CT and MRI
lend additional support for diagnosis of microtumor. parenchyma. Intratumoral cysts may be present as
Dynamic contrast‐assisted CT and MRI may be used to hypoattenuating foci, and mineralization is hyperattenu
more clearly identify pituitary microtumors by tempo ating. When present, paratumoral edema can appear
ral differences in enhancement of the neurohypophysis hypoattenuating to normal brain parenchyma. On MR
and adenohypophyseal mass. 9,19,20 images, pituitary macrotumors are typically T1 isoin
Imaging features of adenomas, invasive adenomas, tense, variably T2 hyperintense, and may be accompanied
and adenocarcinomas are not sufficiently different to by surrounding T2 hyperintense hypothalamic and
reliably differentiate these entities (Figures 2.9.10, 2.9.11, thalamic edema. Macrotumors are generally intensely
2.9.12, 2.9.13, 2.9.14, 2.9.15, 2.9.16, 2.9.17). 17,21,22 Pituitary and uniformly contrast enhancing on both CT and MR
macroadenomas and adenocarcinomas are greater than images because of the rich vascular supply of the gland. 10,22
10 mm in height and arise from the sellar region.
Although invasive adenomas are on average larger than Other sellar region tumors
noninvasive adenomas (1.9 cm vs. 1.2 cm mean height in Other sellar and parasellar neoplasms that must
one study), this is not a reliable criterion for differentiat be considered as part of an imaging assessment
ing the two. Both macroadenomas and adenocarcinomas include meningioma, primary or secondary lym
can have smooth or irregular margins, can contain cysts phoma, ependymoma, granular cell tumors, and germ
or hemorrhage, and can occasionally be mineralized. cell tumors, among others (Figures 2.9.18, 2.9.19).
On CT images, macrotumors can be isoattenuating Tumors that arise from the neurohypophysis and other
or slightly hypo‐ or hyperattenuating to adjacent brain sellar tumors, such as craniopharyngiomas, are rare.
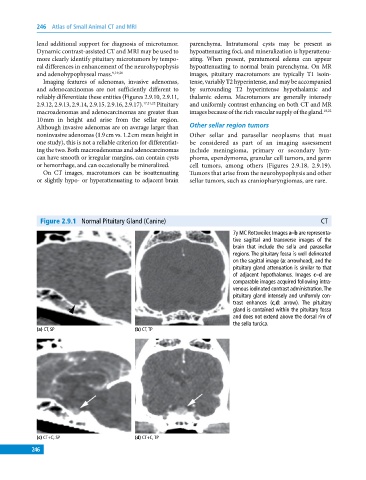
Figure 2.9.1 Normal Pituitary Gland (Canine) CT
7y MC Rottweiler. Images a–b are representa-
tive sagittal and transverse images of the
brain that include the sella and parasellar
regions. The pituitary fossa is well delineated
on the sagittal image (a: arrowhead), and the
pituitary gland attenuation is similar to that
of adjacent hypothalamus. Images c–d are
comparable images acquired following intra-
venous iodinated contrast administration. The
pituitary gland intensely and uniformly con-
trast enhances (c,d: arrow). The pituitary
gland is contained within the pituitary fossa
and does not extend above the dorsal rim of
the sella turcica.
(a) CT, SP (b) CT, TP
(c) CT+C, SP (d) CT+C, TP
246