Page 66 - Diamicron MR MIG Cycle 2(20-21) Final
P. 66

ZACCARDI ET AL.                                                                                   2421

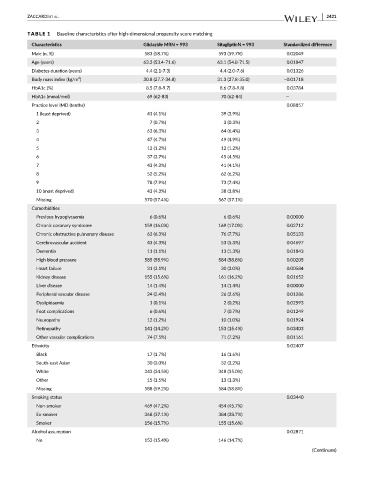
          TABLE 1   Baseline characteristics after high-dimensional propensity score matching
           Characteristics                      Gliclazide MRN = 993    SitagliptinN = 993    Standardized difference
           Male (n, %)                          583 (58.7%)             593 (59.7%)            0.02049
           Age (years)                          63.3 (53.4-71.6)        63.1 (54.8-71.5)       0.01847
           Diabetes duration (years)             4.4 (2.1-7.3)           4.4 (2.0-7.6)         0.01326
                           2
           Body mass index (kg/m )              30.8 (27.7-34.8)        31.3 (27.8-35.0)      −0.01718
           HbA1c (%)                             8.5 (7.8-9.7)           8.6 (7.8-9.8)         0.03784
           HbA1c (mmol/mol)                      69 (62-83)              70 (62-84)           —
           Practice level IMD (tenths)                                                         0.08857
             1 (least deprived)                  41 (4.1%)               39 (3.9%)
             2                                    7 (0.7%)                3 (0.3%)
             3                                   63 (6.3%)               64 (6.4%)
             4                                   47 (4.7%)               49 (4.9%)
             5                                   12 (1.2%)               12 (1.2%)
             6                                   37 (3.7%)               45 (4.5%)
             7                                   43 (4.3%)               41 (4.1%)
             8                                   52 (5.2%)               62 (6.2%)
             9                                   78 (7.9%)               73 (7.4%)
             10 (most deprived)                  43 (4.3%)               38 (3.8%)
             Missing                            570 (57.4%)             567 (57.1%)
           Comorbidities
             Previous hypoglycaemia               6 (0.6%)                6 (0.6%)             0.00000
             Chronic coronary syndrome          159 (16.0%)             169 (17.0%)            0.02712
             Chronic obstructive pulmonary disease  63 (6.3%)            76 (7.7%)             0.05133
             Cerebrovascular accident            43 (4.3%)               53 (5.3%)             0.04697
             Dementia                            11 (1.1%)               13 (1.3%)             0.01843
             High blood pressure                585 (58.9%)             584 (58.8%)            0.00205
             Heart failure                       31 (3.1%)               30 (3.0%)             0.00584
             Kidney disease                     155 (15.6%)             161 (16.2%)            0.01652
             Liver disease                       14 (1.4%)               14 (1.4%)             0.00000
             Peripheral vascular disease         24 (2.4%)               26 (2.6%)             0.01286
             Dyslipidaemia                        1 (0.1%)                2 (0.2%)             0.02593
             Foot complications                   6 (0.6%)                7 (0.7%)             0.01249
             Neuropathy                          12 (1.2%)               10 (1.0%)             0.01924
             Retinopathy                        141 (14.2%)             153 (15.4%)            0.03403
             Other vascular complications        74 (7.5%)               71 (7.2%)             0.01161
           Ethnicity                                                                           0.02407
             Black                               17 (1.7%)               16 (1.6%)
             South-east Asian                    30 (3.0%)               32 (3.2%)
             White                              343 (34.5%)             348 (35.0%)
             Other                               15 (1.5%)               13 (1.3%)
             Missing                            588 (59.2%)             584 (58.8%)
           Smoking status                                                                      0.03440
             Non-smoker                         469 (47.2%)             454 (45.7%)
             Ex-smoker                          368 (37.1%)             384 (38.7%)
             Smoker                             156 (15.7%)             155 (15.6%)
           Alcohol assumption                                                                  0.02871
             No                                 153 (15.4%)             146 (14.7%)
                                                                                                       (Continues)
   61   62   63   64   65   66   67   68   69   70   71