
Page 67 - Diamicron MR MIG Cycle 2(20-21) Final
P. 67
2422 ZACCARDI ET AL.
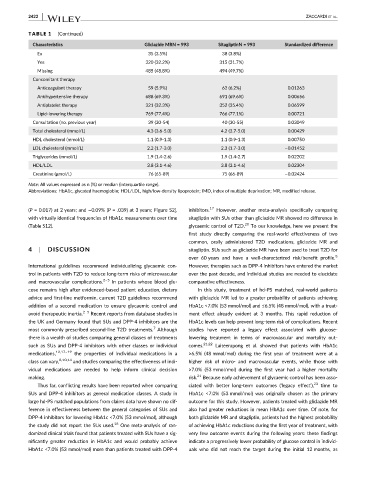
TABLE 1 (Continued)
Characteristics Gliclazide MRN = 993 SitagliptinN = 993 Standardized difference
Ex 35 (3.5%) 38 (3.8%)
Yes 320 (32.2%) 315 (31.7%)
Missing 485 (48.8%) 494 (49.7%)
Concomitant therapy
Anticoagulant therapy 59 (5.9%) 62 (6.2%) 0.01263
Antihypertensive therapy 688 (69.3%) 691 (69.6%) 0.00656
Antiplatelet therapy 321 (32.3%) 352 (35.4%) 0.06599
Lipid-lowering therapy 769 (77.4%) 766 (77.1%) 0.00721
Consultation (no. previous year) 39 (30-54) 40 (30-55) 0.03049
Total cholesterol (mmol/L) 4.3 (3.6-5.0) 4.2 (3.7-5.0) 0.00429
HDL cholesterol (mmol/L) 1.1 (0.9-1.3) 1.1 (0.9-1.3) 0.00750
LDL cholesterol (mmol/L) 2.2 (1.7-3.0) 2.3 (1.7-3.0) −0.01452
Triglycerides (mmol/L) 1.9 (1.4-2.6) 1.9 (1.4-2.7) 0.02202
HDL/LDL 3.8 (3.1-4.6) 3.8 (3.1-4.6) 0.02304
Creatinine ( mol/L) 76 (65-89) 75 (66-89) −0.02424
Note: All values expressed as n (%) or median (interquartile range).
Abbreviations: HbA1c, glycated haemoglobin; HDL/LDL, high/low-density lipoprotein; IMD, index of multiple deprivation; MR, modified release.
(P = 0.017) at 2 years; and −0.09% (P = .039) at 3 years; Figure S2], inhibitors. 17 However, another meta-analysis specifically comparing
with virtually identical frequencies of HbA1c measurements over time sitagliptin with SUs other than gliclazide MR showed no difference in
(Table S12). glycaemic control of T2D. 20 To our knowledge, here we present the
first study directly comparing the real-world effectiveness of two
common, orally administered T2D medications, gliclazide MR and
4 | DISCUSSION sitagliptin. SUs such as gliclazide MR have been used to treat T2D for
over 60 years and have a well-characterized risk/benefit profile. 8
International guidelines recommend individualizing glycaemic con- However, therapies such as DPP-4 inhibitors have entered the market
trol in patients with T2D to reduce long-term risks of microvascular over the past decade, and individual studies are needed to elucidate
and macrovascular complications. 2–5 In patients whose blood glu- comparative effectiveness.
cose remains high after evidenced-based patient education, dietary In this study, treatment of hd-PS matched, real-world patients
advice and first-line metformin, current T2D guidelines recommend with gliclazide MR led to a greater probability of patients achieving
addition of a second medication to ensure glycaemic control and HbA1c <7.0% (53 mmol/mol) and ≤6.5% (48 mmol/mol), with a treat-
avoid therapeutic inertia. 2–5 Recent reports from database studies in ment effect already evident at 3 months. This rapid reduction of
the UK and Germany found that SUs and DPP-4 inhibitors are the HbA1c levels can help prevent long-term risk of complications. Recent
7
most commonly prescribed second-line T2D treatments. Although studies have reported a legacy effect associated with glucose-
there is a wealth of studies comparing general classes of treatments lowering treatment in terms of macrovascular and mortality out-
such as SUs and DPP-4 inhibitors with other classes or individual comes. 21,22 Laiteerapong et al. showed that patients with HbA1c
medications, 12,17–19 the properties of individual medications in a ≥6.5% (48 mmol/mol) during the first year of treatment were at a
class can vary, 8,10,14 and studies comparing the effectiveness of indi- higher risk of micro- and macrovascular events, while those with
vidual medications are needed to help inform clinical decision ≥7.0% (53 mmol/mol) during the first year had a higher mortality
making. risk. 21 Because early achievement of glycaemic control has been asso-
Thus far, conflicting results have been reported when comparing ciated with better long-term outcomes (‘legacy effect’), 23 time to
SUs and DPP-4 inhibitors as general medication classes. A study in HbA1c <7.0% (53 mmol/mol) was originally chosen as the primary
large hd-PS matched populations from claims data have shown no dif- outcome for this study. However, patients treated with gliclazide MR
ference in effectiveness between the general categories of SUs and also had greater reductions in mean HbA1c over time. Of note, for
DPP-4 inhibitors for lowering HbA1c <7.0% (53 mmol/mol), although both gliclazide MR and sitagliptin, patients had the highest probability
the study did not report the SUs used. 18 One meta-analysis of ran- of achieving HbA1c reductions during the first year of treatment, with
domized clinical trials found that patients treated with SUs have a sig- very few outcome events during the following years: these findings
nificantly greater reduction in HbA1c and would probably achieve indicate a progressively lower probability of glucose control in individ-
HbA1c <7.0% (53 mmol/mol) more than patients treated with DPP-4 uals who did not reach the target during the initial 12 months, as