
Page 42 - DYNO TTRAINER
P. 42
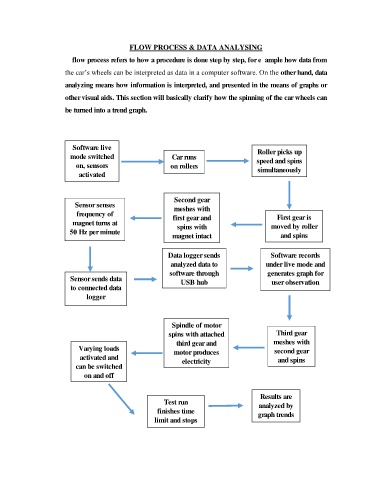
FLOW PROCESS & DATA ANALYSING

                       A flow process refers to how a procedure is done step by step, for example how data from
                       the car’s wheels can be interpreted as data in a computer software. On the other hand, data

                       analyzing means how information is interpreted, and presented in the means of graphs or
                       other visual aids. This section will basically clarify how the spinning of the car wheels can

                       be turned into a trend graph.


                         Software live                                                Roller picks up
                        mode switched                     Car runs                    speed and spins
                          on, sensors                    on rollers                   simultaneously
                           activated


                                                           Second gear
                          Sensor senses                    meshes with
                          frequency of                    first gear and                     First gear is
                         magnet turns at                    spins with                     moved by roller
                        50 Hz per minute
                                                          magnet intact                       and spins

                                                         Data logger sends                 Software records
                                                         analyzed data to                under live mode and
                                                         software through                generates graph for
                        Sensor sends data                    USB hub                       user observation
                        to connected data
                              logger


                                                          Spindle of motor
                                                         spins with attached                Third gear
                                                           third gear and                  meshes with
                           Varying loads                   motor produces                   second gear
                           activated and                     electricity                     and spins
                          can be switched
                             on and off

                                                                                       Results are
                                                       Test run
                                                                                       analyzed by
                                                     finishes time                    graph trends
                                                    limit and stops