
Page 43 - DYNO TTRAINER
P. 43
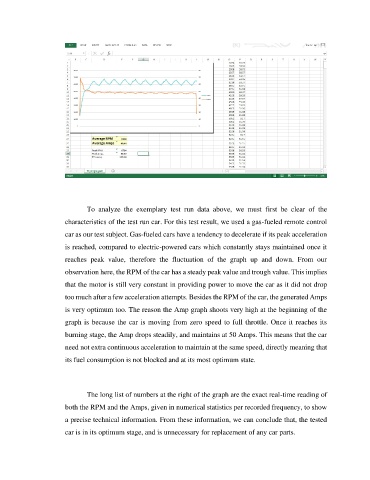
To  analyze  the  exemplary  test  run  data  above,  we  must  first  be  clear  of  the

                       characteristics of the test run car. For this test result, we used a gas-fueled remote control

                       car as our test subject. Gas-fueled cars have a tendency to decelerate if its peak acceleration
                       is reached, compared to electric-powered cars which constantly stays maintained once it

                       reaches  peak  value,  therefore  the  fluctuation  of  the  graph  up  and  down.  From  our
                       observation here, the RPM of the car has a steady peak value and trough value. This implies

                       that the motor is still very constant in providing power to move the car as it did not drop
                       too much after a few acceleration attempts. Besides the RPM of the car, the generated Amps

                       is very optimum too. The reason the Amp graph shoots very high at the beginning of the

                       graph is because the car is moving from zero speed to full throttle. Once it reaches its
                       burning stage, the Amp drops steadily, and maintains at 50 Amps. This means that the car

                       need not extra continuous acceleration to maintain at the same speed, directly meaning that
                       its fuel consumption is not blocked and at its most optimum state.


                              The long list of numbers at the right of the graph are the exact real-time reading of

                       both the RPM and the Amps, given in numerical statistics per recorded frequency, to show

                       a precise technical information. From these information, we can conclude that, the tested
                       car is in its optimum stage, and is unnecessary for replacement of any car parts.