
Page 17 - FY 20 Annual Report: Land Trusts Protection & Advocacy Office
P. 17
Financial Summary FY 2020
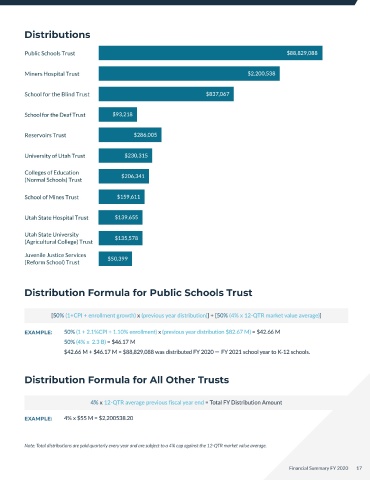
Distributions
In FY 2020 the Utah School and Institutional Trusts permanent Public Schools Trust $88,829,088
funds had a net change in fund market value balance of
-$133.8 million. SITFO’s net income was -$98.9 million, with
operating expenses of $2.7 million and -$96.2 million decrease Miners Hospital Trust $2,200,538
in permanent fund interests and gains. The trust fund balance
fell modestly and returned -3.9%, trending below the primary $837,067
objective of inflation (CPI) + 5%, but not unexpected given the School for the Blind Trust
major global economic disruptions from COVID-19.
While the total fund balance decreased in FY 2020, the total School for the Deaf Trust $93,218
distribution increased. Annual distributions from each trust
are capped at 4% of the average market value of each trust’s
permanent fund over the past 12 consecutive quarters. This Reservoirs Trust $286,005
equaled $93.2 million being distributed to 11 beneficiaries in
FY 2020 (compared to $86.7 million in FY 2019). Approximately,
95% of the total distributions were distributed to Utah’s University of Utah Trust $230,315
public school children under discretion of charter and school
community councils and approved by local school boards. Colleges of Education $206,341
The Land Trusts Protection & Advocacy Office had expenses (Normal Schools) Trust
of $263,111 in FY 2020.
SITLA brought in a total net revenue of $61 million in FY 2020. School of Mines Trust $159,611
SITLA revenues were shared among three major categories:
mineral revenues (18%); development and planning revenues
(20%); and surfacer revenues (6%). Development and planning Utah State Hospital Trust $139,655
revenue grew by 9%, while mineral and surface revenues fell.
Mineral revenue fell 27%, and surface revenues fell 38%. Utah State University $135,578
While traditional surface revenue (e.g. grazing, forestry, (Agricultural College) Trust
easements, agriculture, and leasing) actually grew in FY 2020 by
10%, auctions and negotiated sales fell by 94% from FY 2019, Juvenile Justice Services $50,399
contributing to a total 38% decrease in surface revenues. (Reform School) Trust
Distributions vs. Market Value Distribution Formula for Public Schools Trust
Total Fund (B) Total Distributions (MM)
[50% (1+CPI + enrollment growth) x (previous year distribution)] + [50% (4% x 12-QTR market value average)]
$2.5 B 100,000
EXAMPLE: 50% (1 + 2.1%CPI + 1.10% enrollment) x (previous year distribution $82.67 M) = $42.66 M
$2.0 B 80,000 50% (4% x 2.3 B) = $46.17 M
$42.66 M + $46.17 M = $88,829,088 was distributed FY 2020 ̶ FY 2021 school year to K-12 schools.
$1.5 B 60,000
Distribution Formula for All Other Trusts
$1 B 40,000
$0.5 B 20,000 4% x 12-QTR average previous fiscal year end = Total FY Distribution Amount
EXAMPLE: 4% x $55 M = $2,200538.20
0 0
1995 2000 2005 2010 2015 2020
1994 2014 2018 Note: Total distributions are paid quarterly every year and are subject to a 4% cap against the 12-QTR market value average.
SITLA SITFO Advocacy
Created Created Created
16 Financial Summary FY 2020 Financial Summary FY 2020 17