
Page 19 - FY 20 Annual Report: Land Trusts Protection & Advocacy Office
P. 19
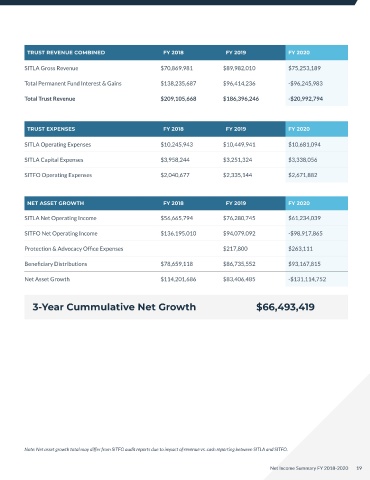
Net Income Summary FY 2018-2020


 TRUST REVENUE  FY 2018  FY 2019  FY 2020  TRUST REVENUE COMBINED  FY 2018  FY 2019             FY 2020

 MINERALS  SITLA Gross Revenue                        $70,869,981          $89,982,010          $75,253,189

 Oil & Gas Royalties  $33,334,309  $34,934,441  $23,299,042
         Total Permanent Fund Interest & Gains        $138,235,687         $96,414,236          -$96,245,983
 Coal Royalties  $1,200,147  $1,004,562  $701,262
         Total Trust Revenue                          $209,105,668         $186,396,246         -$20,992,794
 Other Minerals  $4,171,551  $4,712,188  $5,198,233
 Materials Permits  $1,374,152  $1,162,080  $1,317,060
          TRUST EXPENSES                               FY 2018              FY 2019             FY 2020
 Total Mineral Revenue  $40,080,159  $41,813,270  $30,515,597
         SITLA Operating Expenses                     $10,245,943          $10,449,941          $10,681,094
 DEVELOPMENT & PLANNING
         SITLA Capital Expenses                       $3,958,244           $3,251,324           $3,338,056
 Development Sales & Leases  $18,702,379  $31,598,032  $34,464,651
         SITFO Operating Expenses                     $2,040,677           $2,335,144           $2,671,882
 Total Development & Planning Revenue  $18,702,379  $31,598,032  $34,464,651


 SURFACE  NET ASSET GROWTH                             FY 2018              FY 2019             FY 2020

 Sales (Auctions & Negotiated Sales)  $2,989,190  $7,622,007  $460,387  SITLA Net Operating Income  $56,665,794  $76,280,745  $61,234,039

 Easements  $818,102  $770,270  $1,266,038  SITFO Net Operating Income  $136,195,010  $94,079,092  -$98,917,865

 Rights of Entry  $191,099  $176,937  $192,358  Protection & Advocacy Office Expenses  $217,800  $263,111

 Agriculture  $159,391  $118,992  $121,916  Beneficiary Distributions  $78,659,118  $86,735,552  $93,167,815

 Commercial  $2,130,332  $2,109,193  $2,310,172  Net Asset Growth  $114,201,686  $83,406,485    -$131,114,752


 Governmental  $339,812  $269,140  $459,282
            3-Year Cummulative Net Growth                                             $66,493,419
 Industrial  $2,859,463  $2,787,079  $2,769,574

 Residential  $76,688  $79,462  $75,965

 Telecommunications  $1,101,426  $1,216,212  $1,164,694

 Forestry  $89,059  $42,845  $91,701

 Grazing  $1,332,881  $1,378,571  $1,360,854

 Total Surface Revenue  $12,087,443  $16,570,708  $10,272,941


 SITFO ̶ PERMANENT FUND INTERESTS & GAINS

 Permanent Fund Interest & Gains  $138,235,687  $96,414,236  -$96,245,983


         Note: Net asset growth total may differ from SITFO audit reports due to impact of revenue vs. cash reporting between SITLA and SITFO.


 18  Net Income Summary FY 2018-2020                                                      Net Income Summary FY 2018-2020  19