
Page 23 - FY 20 Annual Report: Land Trusts Protection & Advocacy Office
P. 23
Schedule of SITFO Expenditures Calendar Performance
Figure 4: Calendar Performance
30.0%
FUND OPERATING EXPENSES INVOICED INVESTMENT MANAGEMENT (IM) FEES
20.0%
SITFO Investment Office Budget $1,088,853 BMO $356,960
10.0% Figure 4: Calendar Performance
Audit Expense $49,506 Cliffwater $18,182
30.0%
Investment Systems & Publications $132,539 Loomis $355,417 0.0%
20.0%
Consulting Services $1,088,306 Parametric $869,708 -10.0%
10.0%
Custodial Banking Services $312,679 Salient $840,165 -20.0%
0.0%
Subtotal Fund Operating Expenses $2,671,833 Subtotal Invoiced IM Fees $2,440,443 -30.0%
2020 2019 2018 2017 2016 2015 2014 2013 2012 2011 2010 2009 2008
* Note: Investment manager expenses are included in the sum total of the -10.0%
Investment and Gains line item on the Financial summary income statement Total Fund -3.9% 12.0% -4.0% 10.4% 5.9% 2.2% 8.7% 20.2% 13.5% 2.3% 12.1% 19.8% -26.0%
(see page 18). -20.0%
CPI + 5%
Annualized Returns by Fiscal Year Table -30.0% 2020 5.7% 7.1% 7.1% 5.6% 5.8% 6.7% 6.8% 8.0% 6.4% 8.0% 5.9% 6.7% 7.4%
2019
2018
2017
2009
2008
2010
2016
2014
2013
2012
2011
2015
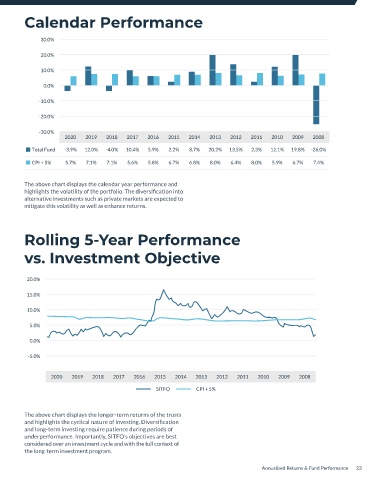
The above chart displays the calendar year performance and
Total Fund -3.9% 12.0% -4.0% 10.4% 5.9% 2.2% 8.7% 20.2% 13.5% 2.3% 12.1% 19.8% -26.0%
TRUSTS MARKET VALUE ANNUALIZED RETURNS (AS OF 6/30/20) highlights the volatility of the portfolio. The diversification into
alternative investments such as private markets are expected to
CPI + 5% 5.7% 7.1% 7.1% 5.6% 5.8% 6.7% 6.8% 8.0% 6.4% 8.0% 5.9% 6.7% 7.4%
6/30/19 6/30/20 FY 2020 3Y 5Y 10Y mitigate this volatility as well as enhance returns.
Public Schools Trust $2,451,730,106 $2,330,074,981 -3.9% 1.8% 3.0% 7.8%
Figure 4: Calendar Performance
Miners Hospital Trust $59,213,881 $56,443,715 -3.9% 1.8% 3.0% 8.2% Rolling 5-Year Performance
School for the Blind Trust $21,683,655 $20,128,580 -3.9% 1.8% 3.0% 8.2% 20.0%
15.0%
School for the Deaf Trust $2,664,317 $2,743,275 -3.9% 1.8% 3.0% 7.9% vs. Investment Objective
10.0% Figure 4: Calendar Performance
Reservoirs Trust $7,787,668 $7,440,425 -3.9% 1.8% 3.0% 7.8%
20.0%
University of Utah Trust $7,035,353 $7,551,006 -3.9% 1.8% 3.0% 7.8% 5.0%
15.0%
Colleges of Education $5,957,478 $6,140,708 -3.9% 1.8% 3.0% 7.7% 0.0%
(Normal Schools) Trust 10.0%
School of Mines Trust $4,843,678 $4,880,999 -3.9% 1.8% 3.0% 8.0% -5.0%
5.0%
Utah State Hospital Trust $4,374,662 $4,395,262 -3.9% 1.8% 2.9% 7.9%
0.0% 2020 2019 2018 2017 2016 2015 2014 2013 2012 2011 2010 2009 2008
Utah State University $4,072,939 $5,192,134 -3.9% 1.8% 2.9% 7.9%
(Agricultural College) Trust -5.0% SITFO CPI + 5%
Juvenile Justice Services $1,343,827 $1,511,412 -3.9% 1.8% 3.0% 8.0%
(Reform School) Trust
2020 2019 2018 2017 2016 2015 2014 2013 2012 2011 2010 2009 2008
INVESTMENT OBJECTIVE FY 2020 3Y 5Y 10Y
SITFO CPI + 5%
Inflation (CPI) + 5% 5.7% 6.8% 6.6% 6.8%
Over the past four years, SITFO has been strategically diversifying are slower to return capital. SITFO expects that reducing the The above chart displays the longer-term returns of the trusts
the trust by reducing over-exposures to equity and introducing equity allocation from 70% to 37%, investing in alternative and highlights the cyclical nature of investing. Diversification
alternative markets investments, which typically follow j-curves markets, and increasing greater diversification is expected to and long-term investing require patience during periods of
and had not recovered from the COVID related market yield, over time, higher long-term returns for the trust and underperformance. Importantly, SITFO’s objectives are best
corrections by the end of FY 2020. Additionally, SITFO has reduce portfolio volatility. considered over an investment cycle and with the full context of
investments in private markets, which take years to deploy and the long-term investment program.
22 Annualized Returns & Fund Performance Annualized Returns & Fund Performance 23