
Page 21 - FY 20 Annual Report: Land Trusts Protection & Advocacy Office
P. 21
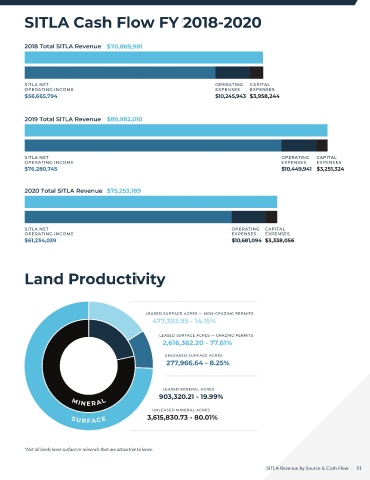
SITLA Cash Flow
 SITLA Revenue By Source FY 2018-2
 SITLA Revenue By Source 2017-2019020  SITLA Cash Flow FY 2018-2020


 Mineral Revenue  2018 Total SITLA Revenue  $70,869,981


 FY 2018  $33,334,309
 Oil & gas royalties  FY 2019  $34,934,441
 FY 2020  $23,299,042                                                                                                    Mineral Revenue
 $1,200,147  SITLA NET                                                  OPERATING   CAPITAL
 Coal royalties  $1,004,562  OPERATING INCOME                           EXPENSES    EXPENSES                             OIL & GAS ROYALTIES
 $701,262  $56,665,794                                                  $10,245,943 $3,958,244

 $4,171,551
 Other royalties  $4,712,188
 $5,198,233  2019 Total SITLA Revenue  $89,982,010
 $1,374,152
 Materials permits  $1,162,080
 $1,317,060


 Development & Planning Revenue  SITLA NET                                                    OPERATING   CAPITAL
                                                                                                          EXPENSES
         OPERATING INCOME
                                                                                              EXPENSES
         $76,280,745                                                                          $10,449,941 $3,251,324
 $18,702,379
 Sales & leases  $31,598,032
 $34,464,651
         2020 Total SITLA Revenue   $75,253,189
 Surface Revenue


 Sales (auctions &  $2,989,190  $7,622,007  SITLA NET                         OPERATING   CAPITAL
 negotiated sales)  $460,387  OPERATING INCOME                                EXPENSES   EXPENSES
 FY 2019  $61,234,039                                                         $10,681,094 $3,338,056
 $818,102  TOTAL GROSS REVENUE
 Easements  $770,270  $89,982,010
 $1,266,038

 $191,099  TOTAL SURFACE
 Rights of entry  $176,937  REVENUE  FY 2020
 $192,358  FY 2018  $16,570,708  TOTAL GROSS REVENUE  Land Productivity
 TOTAL GROSS REVENUE  $75,253,189
 $159,391  $70,869,981
 Agriculture  $118,992
 $121,916  TOTAL SURFACE
 TOTAL SURFACE  TOTAL DEVELOPMENT  REVENUE
 & PLANNING REVENUE
 $2,130,332  REVENUE  $31,598,032  $10,272,941
 Commercial  $2,109,193  $12,087,443             LEASED SURFACE ACRES — NON-GRAZING PERMITS
 $2,310,172                                          477,393.95 - 14.15%
 TOTAL DEVELOPMENT
 $339,812  & PLANNING REVENUE
 Governmental  $269,140  TOTAL DEVELOPMENT  $34,464,651  LEASED SURFACE ACRES — GRAZING PERMITS
 & PLANNING REVENUE
 $459,282  $18,702,379                                  2,616,362.20 - 77.61%
 $2,859,463
 Industrial  $2,787,079                                UNLEASED SURFACE ACRES
 $2,767,574                                             277,966.64 - 8.25%
 TOTAL MINERAL
 $76,688  TOTAL MINERAL  REVENUE
 Residential  $79,462  REVENUE  $41,813,270
 $75,965  $40,080,159
                                                         LEASED MINERAL ACRES
 $1,101,426  TOTAL MINERAL                            903,320.21 - 19.99%
 Telecommunications  $1,216,212  REVENUE  MINE R AL
 $1,164,694  $30,515,597
                                                      UNLEASED MINERAL ACRES
 $89,059                 SURFACE                  3,615,830.73 - 80.01%
 Forestry  $42,845
 $91,701
 $1,332,881
 Grazing  $1,378,571
 $1,360,854  *Not all lands have surface or minerals that are attractive to lease.


 20  SITLA Revenue by Source & Cash Flow                                                 SITLA Revenue by Source & Cash Flow  21