
Page 16 - Design Considerations Based on Quantitative Risk Assessments for Slopes
P. 16
Frequency vs Fatality Chart
Definition
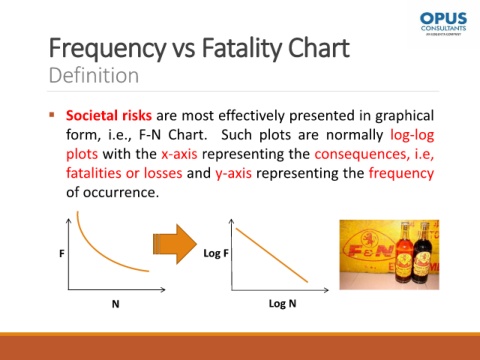
▪ Societal risks are most effectively presented in graphical
form, i.e., F-N Chart. Such plots are normally log-log
plots with the x-axis representing the consequences, i.e,
fatalities or losses and y-axis representing the frequency
of occurrence.
F Log F
N Log N