
Page 3 - Health-related Quality Of Life Of The Elderly
P. 3
A. O. Ogunyemi and Associates Health-Related Quality of Life
RESULTS was statistically significant (p<0.001). those in the institution except in the
Socio-demographic characteristics The mean physical component score of domain for bodily pain. This means
of respondents of the two groups are the respondents in the non-institutional residents living at homes within
reported in Table 1. In this study the group (61.9±18.1) was higher than the communities possessed better HRQOL
respondents in the institutional group mean score among respondents in the than nursing home residents. For elderly
had a mean age of 78±8.8 years and were institutional group (50.6±20.6) and this residents in institutions, physical
older than the respondents in the non- difference was statistically significant function yielded the lowest score
institutional group who had a mean age (p<0.001). The mean mental component (43.4±34.9) followed by role physical
of 70.1±8.2 years. Mean and standard score of the respondents in the whereas for non-institutional residents
deviation scores of eight domains, total institutional group (55.2±13.7) was lower the lowest score was role physical
physical and total mental health than the mean score among respondents (60.2±25.9) followed by physical
summaries are shown in Table 2. The total in the non-institutional group (67.9±15.7) function. The Health Related Quality of
mean HRQOL score was 64.5±15.6 among and this difference was statistically Life (HRQOL) scores of the eight domains
respondents in the non-institutional significant (p<0.001). The respondents in surveyed ranged from 43.4±34.9 to
group higher than 52.6±15.7 in the the non-institutional group scored 66.3±28.0 with a mean score of 52.6±15.7
institutional group and this difference significantly better in all domains than in the institutional group and 60.2±25.9
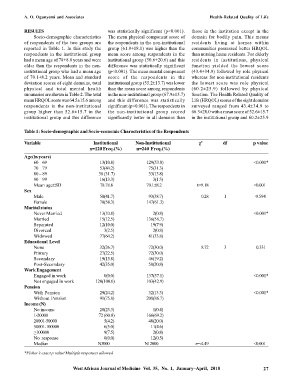
Table 1: Socio-demographic and Socio-economic Characteristics of the Respondents
Variable Institutional Non-Instittutional χ 2 df p value
n=120 Freq.(%) n=240 Freq.(%)
Age(in years)
60 – 69 13(10.8) 129(53.8) <0.001*
70 – 79 53(44.2) 75(31.3)
80 – 89 38 (31.7) 33(13.8)
90 – 99 16(13.3) 3(1.3)
Mean ageSD 78.78.8 70.18.2 t=9.18 <0.001
Sex
Male 50(41.7) 93(38.7) 0.28 1 0.594
Female 70(58.3) 147(61.3)
Marital status
Never Married 13(10.8) 2(0.8) <0.001*
Married 15(12.5) 136(56.7)
Separated 12(10.0) 19(7.9)
Divorced 3(2.5) 2(0.8)
Widowed 77(64.2) 81(33.8)
Educational Level
None 32(26.7) 72(30.0) 8.72 3 0.331
Primary 27(22.5) 72(30.0)
Secondary 19(15.8) 46(19.2)
Post-Secondary 42(35.0) 50(20.8)
Work Engagement
Engaged in work 0(0.0) 137(57.1) <0.001*
Not engaged in work 120(100.0) 103(42.9)
Pension
With Pension 29(24.2) 32(13.3) <0.001*
Without Pension 91(75.8) 208(86.7)
Income (N)
No income 28(23.3) 1(0.4)
1-20000 72 (60.0) 166(69.2)
20001-50000 5(4.2) 48(20.0)
50001-100000 6(5.0) 11(4.6)
>100000 9(7.5) 2(0.8)
No response 0(0.0) 12(0.5)
Median N3000 N12000 z=-4.49 <0.001
*Fisher’s exact p value Multiple responses allowed
1
West African Journal of Medicine Vol. 35, No. 1, January–April, 2018 27