Page 4 - Health-related Quality Of Life Of The Elderly
P. 4

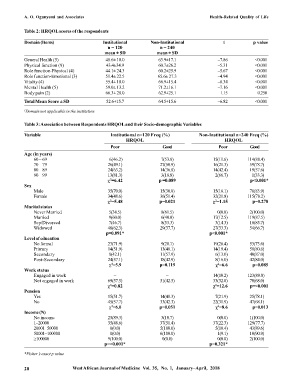
A. O. Ogunyemi and Associates                                                 Health-Related Quality of  Life

           Table 2: HRQOL scores of the respondents

           Domain (Items)                   Institutional       Non-Institutional                 t                           p value
                                              n = 120               n = 240
                                             mean ± SD             mean ± SD
           General Health (5)                48.6± 18.0            63.9±17.1                –7.86           <0.001
           Physical function (9)             43.4±34.9             60.7±26.2                –5.31           <0.001
           Role function-Physical (4)        44.1± 24.3            60.2±25.9                –5.67           <0.001
           Role function-Emotional (3)       51.4± 22.5            65.6± 27.3               –4.94           <0.001
           Vitality (4)                      55.4± 18.0            66.9±15.4                –6.34           <0.001
           Mental Health (5)                 59.0± 13.2            71.2±16.1                –7.16           <0.001
           Body pain (2)                     66.3± 28.0            62.9±25.1                 1.15            0.250
           Total Mean Score ± SD             52.6±15.7             64.5±15.6                –6.82           <0.001
           1 Domain not applicable in the institution


           Table 3: Association between Respondents HRQOL and their Socio-demographic Variables
           Variable                                                      Institutional n=120 Freq (%)                             Non-Institutional n=240 Freq (%)
                                                                          HRQOL                                                       HRQOL
                                               Poor                  Good                   Poor         Good
           Age (in years)
               60 – 69                          6(46.2)             7(53.8)               15(11.6)      114(88.4)
               70 – 79                        26(49.1)              27(50.9)              16(21.3)       59(78.7)
               80 – 89                        24(63.2)              14(36.8)              14(42.4)       19(57.6)
               90 – 99                        13(81.3)              3(18.8)                2(66.7)        1(33.3)
                                               =6.42              p =0.089                               p<0.001*
                                               2
           Sex
               Male                           35(70.0)              15(30.0)              15(16.1)       78(83.9)
               Female                         34(48.6)              36(51.4)              32(21.8)      115(78.2)
                                               =5.48               p=0.021                =1.15          p=0.278
                                               2
                                                                                           2
           Marital status
               Never Married                  5(38.5)               8(61.5)                 0(0.0)       2(100.0)
               Married                        9(60.0)               6(40.0)               17(12.5)      119(87.5)
               Sep/Divorced                   7(46.7)               8(53.3)                3(14.3)       18(85.7)
               Widowed                        48(62.3)              29(37.7)              27(33.3)       54(66.7)
                                             p=0.091*                                    p<0.001*
           Level of education
               No formal                      23(71.9)              9(28.1)               19(26.4)       53(73.6)
               Primary                        14(51.9)              13(48.1)              14(19.4)       58(80.6)
               Secondary                       8(42.1)              11(57.9)               6(13.0)       40(87.0)
               Post-Secondary                 24(57.1)              18(42.9)               8(16.0)       42(84.0)
                                                =5.9               p=0.119                χ =6.6          p=0.085
                                                2
                                                                                            2
           Work status
               Engaged in work                   –                    –                   14(10.2)      123(89.8)
               Not engaged in work            69(57.5)              51(42.5)              33(32.0)       70(68.0)
                                               =0.82                                     χ =12.6        p=<0.001
                                               2
                                                                                           2
           Pension
               Yes                            15(51.7)              14(48.3)               7(21.9)       25(78.1)
               No                             45(57.7)              33(42.3)              22(31.9)       47(68.1)
                                                =6.0               p=0.051                χ =8.6          p=0.013
                                                2
                                                                                            2
           Income (N)
               No income                      25(89.3)              3(10.7)                 0(0.0)       1(100.0)
               1–20000                        35(48.6)              37(51.4)              37(22.3)      129(77.7)
               20001–50000                     0(0.0)               5(100.0)               5(10.4)       43(89.6)
               50001–100000                    0(0.0)               6(100.0)                1(9.1)       10(90.9)
               >100000                        9(100.0)               0(0.0)                 0(0.0)       2(100.0)
                                             p=<0.001*                                   p=0.321*

           *Fisher’s exact p value

           28                  West African Journal of Medicine   Vol.  35,   No.  1,   January–April,   2018
   1   2   3   4   5   6   7   8