
Page 5 - Health-related Quality Of Life Of The Elderly
P. 5
A. O. Ogunyemi and Associates Health-Related Quality of Life
to 71.2±16.1 with a mean score of 64.5±15.6 logical well-being and stress. The older institutional group had good HRQOL
in the non-institutional group from a respondents had poorer HRQOL scores scores higher than 68.0% of those who
possible 0 to 100. HRQOL scores greater compared to the younger and this were not working (p<0.001). The HRQOL
80
than 50 indicate a good score. The difference was statistically significant in scores of respondents was good as
lowest score in the institutional group the non-institutional group (p<0.001). income increased and this was
(43.4±34.9) was the domain for physical The married and those who were never statistically significant in the institutional
function which assesses health problems married had better HRQOL scores than group (p<0.001) in Table 3. After
resulting in limitation of physical the separated, divorced or widowed in controlling for the effect of the
activities and the highest (66.3±28.0) was the non-institutional group and this statistically significant variables which
in the body pain which assesses daily difference was statistically significant were respondents place of residence,
age, sex, marital status, work status,
activities influenced by pain. The domain (p<0.001). Gender had a significant pension, income and presence of co-
with the lowest score (60.2±25.9) in the relationship with the HRQOL scores with morbid condition, the respondents who
non-institutional group was the domain the females having better scores (p<0.05). belonged to the non-institutional group
for physical role function which assesses There was also no statistically significant (OR=2.37), who were female (OR=2.00),
the physical disability resulting in relationship between the respondents’ who were engaged in work (OR=4.93) and
limitations of usual role activities and the level of education and HRQOL scores. who had no co-morbid condition
highest (71.2±16.1) was in the mental Ninety percent of the respondents who (OR=7.58) were significantly more likely
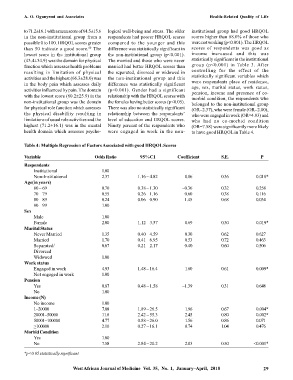
health domain which assesses psycho- were engaged in work in the non- to have good HRQOL in Table 4.
Table 4: Multiple Regression of Factors Associated with good HRQOL Scores
Variable Odds Ratio 95%CI Coefficient S.E. P
Respondents
Institutional 1.00
Non-Institutional 2.37 1.16 – 4.82 0.86 0.36 0.018*
Age(in years)
60 – 69 0.70 0.38 – 1.30 –0.36 0.32 0.258
70 – 79 0.55 0.26 – 1.16 –0.60 0.38 0.116
80 – 89 0.24 0.06 – 0.90 –1.45 0.68 0.034
90 – 99 1.00
Sex
Male 1.00
Female 2.00 1.12 – 3.57 0.69 0.30 0.019*
Marital Status
Never Married 1.35 0.40 – 4.59 0.30 0.62 0.627
Married 1.70 0.41 – 6.95 0.53 0.72 0.463
Separated/ 0.67 0.21 – 2.17 –0.40 0.60 0.506
Divorced
Widowed 1.00
Work status
Engaged in work 4.93 1.48 – 16.4 1.60 0.61 0.009*
Not engaged in work 1.00
Pension
Yes 0.87 0.48 – 1.58 –1.39 0.31 0.648
No 1.00
Income (N)
No income 1.00
1–20000 7.08 1.89 – 26.5 1.96 0.67 0.004*
20001–50000 11.6 2.42 – 55.3 2.45 0.80 0.002*
50001–100000 4.77 0.88 – 26.0 1.56 0.86 0.071
>100000 2.10 0.27 – 16.1 0.74 1.04 0.476
Morbid Condition
Yes 1.00
No 7.58 2.84 – 20.2 2.03 0.50 <0.001*
*p<0.05 statistically significant
West African Journal of Medicine Vol. 35, No. 1, January–April, 2018 29