
Page 109 - Clinical Managers Orientation Binder
P. 109
Financial Reporting Process
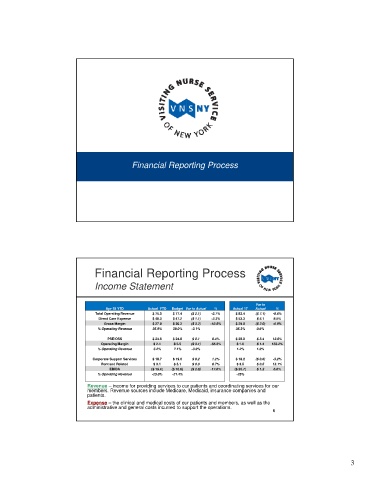
Financial Reporting Process
Income Statement
Var to
Apr-18 YTD Actual YTD Budget Var to Actual % Actual 17 Actual %
Total Operating Revenue $ 75.3 $ 77.4 ($ 2.1) -2.7% $ 82.4 ($ 7.1) -8.6%
Direct Care Expense $ 48.3 $ 47.2 ($ 1.1) -2.3% $ 53.3 $ 5.1 9.5%
Gross Margin $ 27.0 $ 30.2 ($ 3.2) -10.5% $ 29.0 ($ 2.0) -6.9%
% Operating Revenue 35.9% 39.0% -3.1% 35.3% 0.6%
PSE/OSS $ 24.6 $ 24.8 $ 0.1 0.4% $ 28.0 $ 3.4 12.0%
Operating Margin $ 2.4 $ 5.5 ($ 3.1) -56.3% $ 1.0 $ 1.4 133.2%
% Operating Revenue 3.2% 7.1% -3.9% 1.2% 1.9%
Corporate Support Services $ 18.7 $ 19.0 $ 0.2 1.2% $ 18.2 ($ 0.6) -3.2%
Rent and Related $ 3.1 $ 3.1 $ 0.0 0.7% $ 3.5 $ 0.5 13.1%
EBIDA ($ 19.4) ($ 16.6) ($ 2.8) -17.0% ($ 20.7) $ 1.2 6.0%
% Operating Revenue -25.8% -21.4% -25%
Revenue – income for providing services to our patients and coordinating services for our
members. Revenue sources include Medicare, Medicaid, insurance companies and
patients.
Expense – the clinical and medical costs of our patients and members, as well as the
administrative and general costs incurred to support the operations.
6
3