Page 110 - Clinical Managers Orientation Binder
P. 110

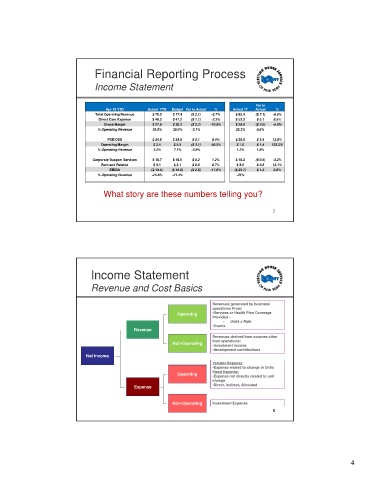
Financial Reporting Process

                                Income Statement


                                                                                      Var to
                                    Apr-18 YTD    Actual  YTD  Budget Var to Actual  %  Actual 17  Actual  %
                                Total Operating Revenue  $ 75.3  $ 77.4  ($ 2.1)  -2.7%  $ 82.4  ($ 7.1)  -8.6%
                                  Direct Care Expense  $ 48.3  $ 47.2  ($ 1.1)  -2.3%  $ 53.3  $ 5.1  9.5%
                                   Gross Margin    $ 27.0  $ 30.2  ($ 3.2)  -10.5%  $ 29.0  ($ 2.0)  -6.9%
                                 % Operating Revenue  35.9%  39.0%  -3.1%      35.3%  0.6%
                                     PSE/OSS       $ 24.6  $ 24.8  $ 0.1  0.4%  $ 28.0  $ 3.4  12.0%
                                  Operating Margin  $ 2.4  $ 5.5  ($ 3.1)  -56.3%  $ 1.0  $ 1.4  133.2%
                                 % Operating Revenue  3.2%  7.1%  -3.9%        1.2%   1.9%
                                Corporate Support Services  $ 18.7  $ 19.0  $ 0.2  1.2%  $ 18.2  ($ 0.6)  -3.2%
                                  Rent and Related  $ 3.1  $ 3.1  $ 0.0  0.7%  $ 3.5  $ 0.5  13.1%
                                     EBIDA         ($ 19.4)  ($ 16.6)  ($ 2.8)  -17.0%  ($ 20.7)  $ 1.2  6.0%
                                 % Operating Revenue  -25.8%  -21.4%           -25%

                                   What story are these numbers telling you?


                                                                                           7


                               Income Statement

                               Revenue and Cost Basics


                                                                       Revenues generated by business
                                                                       operations From:
                                                            Operating  •Services or Health Plan Coverage
                                                                       Provided –
                                                                           •  Units x Rate
                                                                       •Grants
                                             Revenueenue
                                             Rev
                                                                       Revenues derived from sources other
                                                                       than operations:
                                                          Non-Operating
                                                                       •investment income
                                                                       •development contributions
                             Net Income
                                                                       Variable Expense:
                                                                       •Expense related to change in Units
                                                            Operating  Fixed Expense:
                                                                       •Expense not directly related to unit
                                                                       change
                                                                       •Direct, Indirect, Allocated
                                             Expense
                                                          Non-Operating  Investment Expense
                                                                                           8


                                                                                                                     4
   105   106   107   108   109   110   111   112   113   114   115