
Page 116 - Clinical Managers Orientation Binder
P. 116
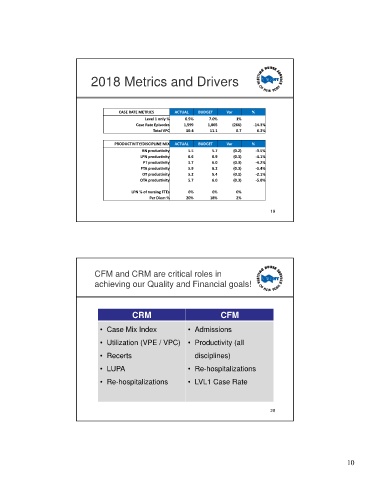
2018 Metrics and Drivers


                                        CASE RATE METRICS  ACTUAL  BUDGET   Var     %
                                                 Level 1 only %  6.5%  7.0%    1%
                                              Case Rate Episodes  1,599  1,865  (266)  -14.3%
                                                    Total VPC  10.4   11.1     0.7    6.3%
                                       PRODUCTIVITY/DISCIPLINE MIX  ACTUAL  BUDGET  Var  %
                                                RN productivity  5.5   5.7    (0.2)   -3.5%
                                               LPN productivity  6.6   6.9    (0.3)   -4.1%
                                                PT productivity  5.7   6.0    (0.3)   -4.2%
                                                PTA productivity  5.9   6.2   (0.3)   -5.4%
                                                OT productivity  5.2   5.4    (0.1)   -2.1%
                                               OTA productivity  5.7   6.0    (0.3)   -5.0%
                                             LPN % of nursing FTEs  6%  6%     0%
                                                  Per Diem %   20%     18%     2%

                                                                                           19


                                CFM and CRM are critical roles in
                                achieving our Quality and Financial goals!


                                             CRM                          CFM

                                  • Case Mix Index             • Admissions

                                  • Utilization (VPE / VPC)    • Productivity (all
                                  • Recerts                      disciplines)

                                  •LUPA                        • Re-hospitalizations

                                  • Re-hospitalizations        • LVL1 Case Rate


                                                                                           20


                                                                                                                    10