Page 243 - Fluid, Electrolyte, and Acid-Base Disorders in Small Animal Practice
P. 243

234        ACID-BASE DISORDERS


            For thepreviouslydescribedsolutionofsodiumphosphate:   TABLE 9-2       pK a Values of

                                                                                   Biologically Important
                                    ½Na 2 HPO 4 Š
                             þ
                           ½H Š¼ K a                                               Compounds*
                                    ½NaH 2 PO 4 Š
                                                                 Compound                               pK a
            The K a for this reaction is 1.6   10  7  Eq/L, and if there
            are equal amounts of the two phosphate salts present  Phosphoric acid                      2.0
            ([NaH 2 PO 4 ] ¼ [Na 2 HPO 4 ]):                     Citric acid                           2.9
                                                                 Carbonic acid (pK a )                 3.6
                                       7
                         þ
                       ½H Š¼ 1:6   10 Eq=L                       Acetoacetic acid                      3.6
                                                                 Lactic acid                           3.9
                                         ð
                             ¼ 160 nEq=LpH 6:80Þ
                                                                 Citrate 1                             4.3
                                                                 Acetic acid                           4.6
            After addition of 1 mmol of HCl:                     3-Hydroxybutyric acid                 4.7
                                                                 Creatinine                            5.0
                   þ              7         3         3               2
                ½H Š  ¼ ð1:6   10 Þð11   10 Þ=ð9   10 Þ          Citrate                               5.6
                      ¼ 1:95   10  7  Eq=L                       Uric acid                             5.8
                                                                 Organic phosphates                    6.0-7.5
                      ¼ 195 nEq=LpH 6:71Þ
                                   ð
                                                                 Carbonic acid (pK’a)                  6.1
                                                                 Imidazole group of histidine          6.4-7.0
            By contrast, an aqueous solution containing 1 mmol/L  Oxygenated hemoglobin                6.7
                               þ
            HCl would have [H ] ¼ 0.001 mol/L or 1 million       Phosphate 1                           6.8
            nmol/L. Thus, 99.98% of the added hydrogen ions have  a-Amino (amino-terminal)             7.4-7.9
            been buffered by the sodium phosphate solution.      Deoxygenated hemoglobin               7.9
               If the amount of strong acid (e.g., HCl) or base  Ammonium                              9.2
            (e.g., NaOH) added to a solution of a weak acid and its  Bicarbonate                       9.8
            salt (i.e., a buffer solution) is plotted against pH, the  Phosphate 2                    12.4
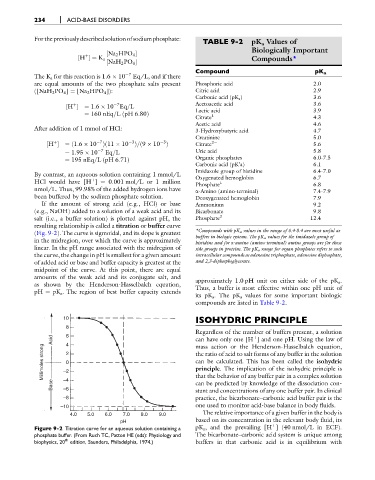
            resulting relationship is called a titration or buffer curve
            (Fig. 9-2). The curve is sigmoidal, and its slope is greatest  *Compounds with pK a values in the range of 6.4-8.4 are most useful as
                                                                 buffers in biologic systems. The pK a values for the imidazole group of
            in the midregion, over which the curve is approximately
                                                                 histidine and for a-amino (amino-terminal) amino groups are for those
            linear. In the pH range associated with the midregion of  side groups in proteins. The pK a range for organ phosphates refers to such
            the curve, the change in pH is smallest for a given amount  intracellular compounds as adenosine triphosphate, adenosine diphosphate,
            of added acid or base and buffer capacity is greatest at the  and 2,3-diphosphoglycerate.
            midpoint of the curve. At this point, there are equal
            amounts of the weak acid and its conjugate salt, and
                                                                 approximately 1.0 pH unit on either side of the pK a .
            as shown by the Henderson-Hasselbalch equation,
                                                                 Thus, a buffer is most effective within one pH unit of
            pH ¼ pK a . The region of best buffer capacity extends
                                                                 its pK a . The pK a values for some important biologic
                                                                 compounds are listed in Table 9-2.
                                                                 ISOHYDRIC PRINCIPLE
                      10
                       8
                                                                 Regardless of the number of buffers present, a solution
                       6
                  Acid  4                                        can have only one [H ] and one pH. Using the law of
                                                                                    þ
                                                                 mass action or the Henderson-Hasselbalch equation,
               Millimoles strong  –2 2 0                         the ratio of acid to salt forms of any buffer in the solution
                                                                 can be calculated. This has been called the isohydric
                                                                 principle. The implication of the isohydric principle is
                  Base  –4                                       that the behavior of any buffer pair in a complex solution
                                                                 can be predicted by knowledge of the dissociation con-
                      –6
                                                                 stant and concentrations of any one buffer pair. In clinical
                      –8                                         practice, the bicarbonate–carbonic acid buffer pair is the
                     –10                                         one used to monitor acid-base balance in body fluids.
                                                                   The relative importance of a given buffer in the body is
                        4.0   5.0  6.0   7.0   8.0   9.0
                                        pH                       based on its concentration in the relevant body fluid, its
                                                                                          þ
            Figure 9-2 Titration curve for an aqueous solution containing a  pK a , and the prevailing [H ] (40 nmol/L in ECF).
            phosphate buffer. (From Ruch TC, Patton HE (eds): Physiology and  The bicarbonate–carbonic acid system is unique among
                      th
            biophysics, 20 edition, Saunders, Philadelphia, 1974.)  buffers in that carbonic acid is in equilibrium with
   238   239   240   241   242   243   244   245   246   247   248