
Page 34 - The Welfare of Cattle
P. 34
Can food ProduCtIon KeeP Its PaCe? 11
COUNterVaILING treNDS
Notwithstanding the increasing demand for higher value proteins resulting from increasing
personal income, there is ample evidence that malnourishment and undernourishment exists
at alarming numbers. While the aggregate numbers are declining, the regional distribution is
shifting also.
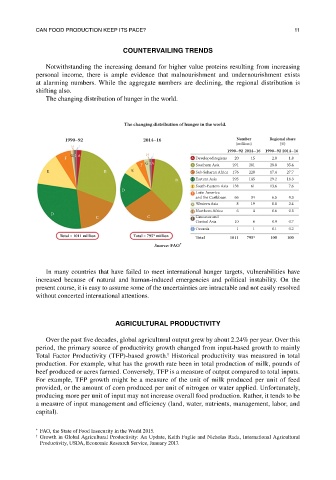
The changing distribution of hunger in the world.
The changing distribution of hunger in the world.
1990–92 2014–16 Number Regional share
(millions) (%)
H J
1990–92 2014–16 1990–92 2014–16
G I A H J
F A Developed regions 20 15 2.0 1.8
F G I A B Southern Asia 291 281 28.8 35.4
E B E C Sub-Saharan Africa 176 220 17.4 27.7
B D Eastern Asia 295 145 29.2 18.3
E South-Eastern Asia 138 61 13.6 7.6
D
F Latin America
and the Caribbean 66 34 6.5 4.3
G Western Asia 8 19 0.8 2.4
H Northern Africa 6 4 0.6 0.5
D
C C I Caucasus and
Central Asia 10 6 0.9 0.7
J Oceania 1 1 0.1 0.2
Total = 1011 million Total = 795* million Total 1011 795* 100 100
Source: FAO *
In many countries that have failed to meet international hunger targets, vulnerabilities have
increased because of natural and human-induced emergencies and political instability. On the
present course, it is easy to assume some of the uncertainties are intractable and not easily resolved
without concerted international attentions.
aGrICULtUraL PrODUCtIVItY
Over the past five decades, global agricultural output grew by about 2.24% per year. Over this
period, the primary source of productivity growth changed from input-based growth to mainly
†
Total Factor Productivity (TFP)-based growth. Historical productivity was measured in total
production. For example, what has the growth rate been in total production of milk, pounds of
beef produced or acres farmed. Conversely, TFP is a measure of output compared to total inputs.
For example, TFP growth might be a measure of the unit of milk produced per unit of feed
provided, or the amount of corn produced per unit of nitrogen or water applied. Unfortunately,
producing more per unit of input may not increase overall food production. Rather, it tends to be
a measure of input management and efficiency (land, water, nutrients, management, labor, and
capital).
* FAO, the State of Food Insecurity in the World 2015.
† Growth in Global Agricultural Productivity: An Update, Keith Fuglie and Nicholas Rada, International Agricultural
Productivity, USDA, Economic Research Service, January 2017.