
Page 237 - Natural Antioxidants, Applications in Foods of Animal Origin
P. 237
216 Natural Antioxidants: Applications in Foods of Animal Origin
VetBooks.ir
Good listener
I AOCS Cd8-S3 I Good listener
Spccrophotomctric
Method
Good listener
Good listener
Good listener
Good listener
Good listener
Good listener
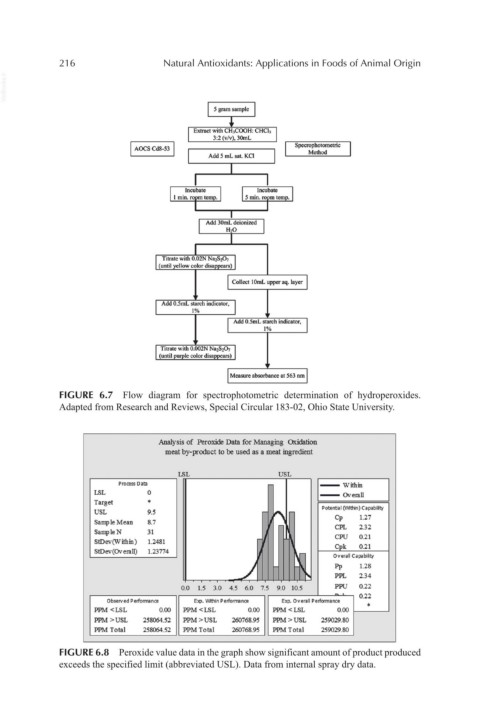
FIGURE 6.7 Flow diagram for spectrophotometric determination of hydroperoxides.
Adapted from Research and Reviews, Special Circular 183-02, Ohio State University.
Analysis of Peroxide Data for Managing Oxidation
meat by-product to be used as a meat ingredient
LSL USL
Process Data ~--Within
LSL 0 --Overall I
Target * Potential ('.\1tlin) Capabilty
USL 9.5 1.27
Sample Mean 8.7 ~"' Cp
SampleN 31 CPL 2.32
StDev(Within) 1.2481 ~ CPU 0.21
Cpk
0.21
StDev(Ov erall) 1.23774 Overall Capabiity
..J rR Pp 2.34
1.28
PPL
0.0 1.5 3.0 4.5 6.0 7.5 9.0 10.5 PPU 0.22
0.22
Observed Perfonnance Exp. 'Mthin Performance Exp. Overall Performance
PPM <LSL 0.00 PPM <LSL 0.00 PPM<LSL 0.00 *
PPM >USL 258064.52 PPM >USL 260768.95 PPM>USL 259029.80
PPM Total 258064.52 PPM Total 260768.95 PPM Total 259029.80
FIGURE 6.8 Peroxide value data in the graph show significant amount of product produced
exceeds the specified limit (abbreviated USL). Data from internal spray dry data.