
Page 236 - Natural Antioxidants, Applications in Foods of Animal Origin
P. 236
Methods and Their Applications for Measuring 215
VetBooks.ir Figure 6.6 shows absorbance at a given wavelength and the difference in
absorbance is based on the molecular characteristics of a compound.
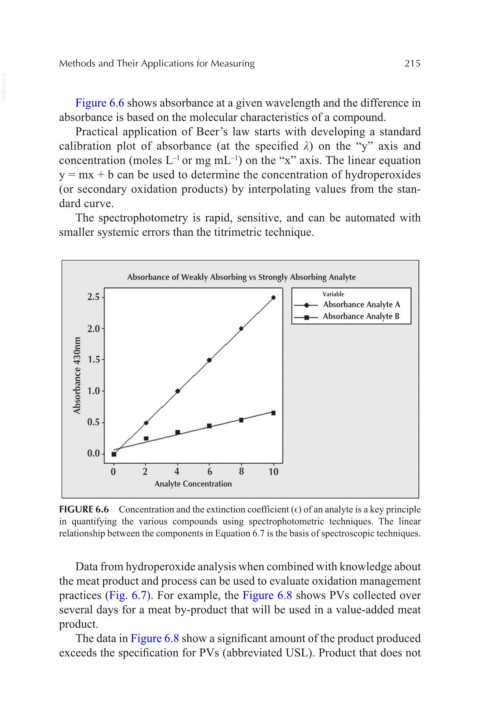
Practical application of Beer’s law starts with developing a standard
calibration plot of absorbance (at the specified λ) on the “y” axis and
concentration (moles L or mg mL ) on the “x” axis. The linear equation
–1
–1
y = mx + b can be used to determine the concentration of hydroperoxides
(or secondary oxidation products) by interpolating values from the stan-
dard curve.
The spectrophotometry is rapid, sensitive, and can be automated with
smaller systemic errors than the titrimetric technique.
Absorbance of Weakly Absorbing vs Strongly Absorbing Analyte
2.5 Variable
- Absorbance Analyte A
- Absorbance Analyte B
2.0
E
0 c:::
M 1.5
"""
Q.l
u
c:::
...
"' 1.0
~
0
"'
~
<(
0.5
0.0
0 2 4 6 8 10
Analyte Concentration
FIGURE 6.6 Concentration and the extinction coefficient (ϵ) of an analyte is a key principle
in quantifying the various compounds using spectrophotometric techniques. The linear
relationship between the components in Equation 6.7 is the basis of spectroscopic techniques.
Data from hydroperoxide analysis when combined with knowledge about
the meat product and process can be used to evaluate oxidation management
practices (Fig. 6.7). For example, the Figure 6.8 shows PVs collected over
several days for a meat by-product that will be used in a value-added meat
product.
The data in Figure 6.8 show a significant amount of the product produced
exceeds the specification for PVs (abbreviated USL). Product that does not