Page 39 - Annual Report 2016 - Cover & Divider Pages.indd
P. 39

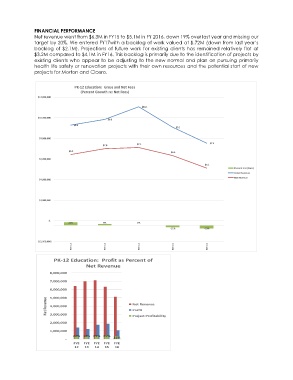
FINANCIAL PERFORMANCE
               Net revenue went from $6.3M in FY15 to $5.1M in FY 2016, down 19% over last year and missing our
               target by 20%. We entered FY17with a backlog of work valued at $.72M (down from last year’s
               backlog of $2.1M).  Projections of future work for  existing clients has remained relatively flat at
               $3.2M compared to $4.1M in FY16. This backlog is primarily due to the identification of projects by
               existing clients who appear to be adjusting to the new normal and plan on pursuing primarily
               health life safety or renovation projects with their own resources and the potential start of new
               projects for Morton and Cicero.

                                PK-12 Education:  Gross and Net Fees
                                   (Percent Growth re: Net Fees)
                  $12,000,000

                                                            $11.1
                  $10,000,000
                                              $9.8
                                $9.3
                                                                          $9.1

                  $8,000,000
                                                          $7.1                           $7.5
                                            $7.0
                              $6.4                                      $6.3
                  $6,000,000
                                                                                       $5.1
                                                                                                   Percent Incr (Decr)
                                                                                                   Gross Revenue
                                                                                                   Net Revenue
                  $4,000,000


                  $2,000,000


                      $-
                              21%           9%            2%
                                                                        -11%          -19%


                  $(2,000,000)
                               FYE 12        FYE 13        FYE 14         FYE 15        FYE 16

                        PK-12 Education:  Profit as Percent of
                                     Net Revenue
                       8,000,000
                       7,000,000
                       6,000,000
                       5,000,000
                    Net Revenue   4,000,000             Net Revenue
                                                        Profit
                       3,000,000
                       2,000,000                        Project Profitability
                       1,000,000
                                22% 17% 25% 29%
                             -                  21%
                                FYE  FYE  FYE  FYE  FYE
                                12  13   14  15  16
   34   35   36   37   38   39   40   41   42   43   44