
Page 41 - Annual Report 2016 - Cover & Divider Pages.indd
P. 41
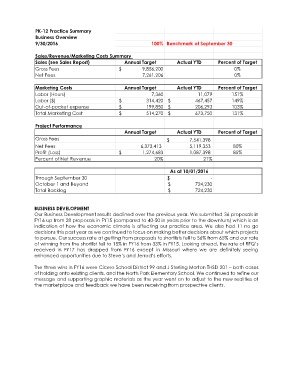
PK-12 Practice Summary
                Business Overview
                9/30/2016                                       100% Benchmark at September 30


                Sales/Revenue/Marketing Costs Summary
                Sales (see Sales Report)             Annual Target         Actual YTD       Percent of Target
                Gross Fees                         $                 9,856,200                     0%
                Net Fees                                              7,261,206                    0%

                Marketing Costs                      Annual Target         Actual YTD       Percent of Target
                Labor (Hours)                                                7,360   11,079       151%
                Labor ($)                          $                    314,420   $                    467,457   149%
                Out-of-pocket expense              $                    199,850   $                    206,293   103%
                Total Marketing Cost               $                    514,270   $                    673,750   131%

                Project Performance
                                                     Annual Target         Actual YTD       Percent of Target
                Gross Fees                                             $                  7,541,398
                Net Fees                                             6,373,413                      5,119,353  80%
                Profit (Loss)                      $                 1,274,683                      1,087,398  85%
                Percent of Net Revenue                            20%                 21%

                                                                        As at 10/01/2016
                Through September 30                                   $                                 -
                October 1 and Beyond                                    $                    724,230
                Total Backlog                                           $                    724,230


               BUSINESS DEVELOPMENT
               Our Business Development results declined over the previous year. We submitted 36 proposals in
               FY16 up from 28 proposals in FY15 (compared to 40-50 in years prior to the downturn) which is an
               indication of how the economic climate is affecting our practice area. We  also had 11 no go
               decisions this past year as we continued to focus on making better decisions about which projects
               to pursue. Our success rate at getting from proposals to shortlists fell to 56% from 65% and our rate
               of winning from the shortlist fell to 15% in FY16 from 33% in FY15. Looking ahead, the rate of RFQ’s
               received  in  FY17  has  dropped  from  FY16  except  in  Missouri  where  we  are  definitely  seeing
               enhanced opportunities due to Steve’s and Jerrod’s efforts.

               The three wins in FY16 were Cicero School District 99 and J Sterling Morton THSD 201 – both cases
               of holding onto existing clients, and the North Park Elementary School. We continued to refine our
               message and supporting graphic materials as the year went on to adjust to the new realities of
               the marketplace and feedback we have been receiving from prospective clients.