
Page 40 - DUT Annual Report 2024
P. 40
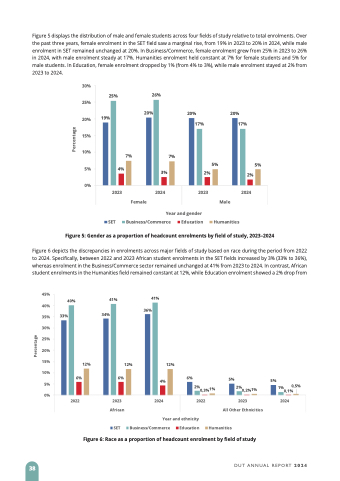
Figure 5 displays the distribution of male and female students across four fields of study relative to total enrolments. Over the past three years, female enrolment in the SET field saw a marginal rise, from 19% in 2023 to 20% in 2024, while male enrolment in SET remained unchanged at 20%. In Business/Commerce, female enrolment grew from 25% in 2023 to 26% in 2024, with male enrolment steady at 17%. Humanities enrolment held constant at 7% for female students and 5% for male students. In Education, female enrolment dropped by 1% (from 4% to 3%), while male enrolment stayed at 2% from 2023 to 2024.
30%
25% 20% 15% 10%
5% 4% 0%
2023
SET
26%
20% 20% 17%
 25%
19%
20% 17%
 7% 7%
3% 2% 2%
 5%
Humanities
5%
 Female
Male
2024 2023
2024
Year and gender Business/Commerce Education
Figure 5: Gender as a proportion of headcount enrolments by field of study, 2023–2024
Figure 6 depicts the discrepancies in enrolments across major fields of study based on race during the period from 2022 to 2024. Specifically, between 2022 and 2023 African student enrolments in the SET fields increased by 3% (33% to 36%), whereas enrolment in the Business/Commerce sector remained unchanged at 41% from 2023 to 2024. In contrast, African student enrolments in the Humanities field remained constant at 12%, while Education enrolment showed a 2% drop from
45%
40% 35% 30% 25% 20% 15% 10%
5% 0%
40%
33%
41% 34%
41% 36%
  12%
12%
12%
 6% 6% 4% 6% 5% 5%
2% 1% 0,3%
1% 0,5% 0,2% 0,1%
    2022 2023 2024 2022 African
2% 1%
2023 2024
   SET
Year and ethnicity Business/Commerce Education
All Other Ethnicities Humanities
Figure 6: Race as a proportion of headcount enrolment by field of study
 38
DUT ANNUAL REPORT 2024
Percentage
Percentage
