
Page 43 - DUT Annual Report 2024
P. 43
100% 90% 80% 70% 60% 50% 40% 30% 20% 10% 0%
Race
88%
85%
87%
79%
77%
80%
Female
2022
Male
Female
Male
Female
Male
2023 Year and gender
2024
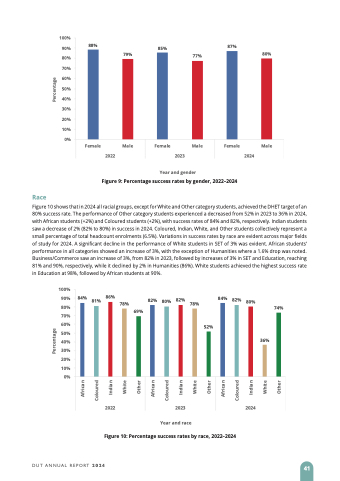
Figure 9: Percentage success rates by gender, 2022–2024
Figure 10 shows that in 2024 all racial groups, except for White and Other category students, achieved the DHET target of an 80% success rate. The performance of Other category students experienced a decreased from 52% in 2023 to 36% in 2024, with African students (+2%) and Coloured students (+2%), with success rates of 84% and 82%, respectively. Indian students saw a decrease of 2% (82% to 80%) in success in 2024. Coloured, Indian, White, and Other students collectively represent a small percentage of total headcount enrolments (6.5%). Variations in success rates by race are evident across major fields of study for 2024. A significant decline in the performance of White students in SET of 3% was evident. African students’ performance in all categories showed an increase of 3%, with the exception of Humanities where a 1.6% drop was noted. Business/Commerce saw an increase of 3%, from 82% in 2023, followed by increases of 3% in SET and Education, reaching 81% and 90%, respectively, while it declined by 2% in Humanities (86%). White students achieved the highest success rate in Education at 98%, followed by African students at 90%.
100% 90% 80% 70% 60% 50% 40% 30% 20% 10% 0%
84% 81% 86%
78%
82% 80% 82%
78%
84% 82% 80%
74%
36%
69%
52%
2022
2023 Year and race
2024
Figure 10: Percentage success rates by race, 2022–2024
DUT ANNUAL REPORT 2024
41
African Coloured Indian White Other African Coloured Indian White Other African Coloured Indian White Other
Percentage
Percentage
