
Page 44 - DUT Annual Report 2024
P. 44
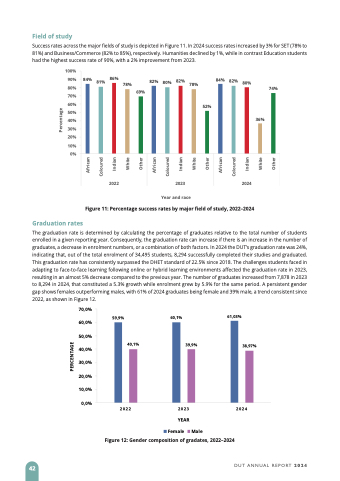
  Field of study
Success rates across the major fields of study is depicted in Figure 11. In 2024 success rates increased by 3% for SET (78% to 81%) and Business/Commerce (82% to 85%), respectively. Humanities declined by 1%, while in contrast Education students had the highest success rate of 90%, with a 2% improvement from 2023.
100% 90% 80% 70% 60% 50% 40% 30% 20% 10% 0%
84% 81% 86%
78%
82% 80% 82%
78%
84% 82% 80%
74%
36%
         69%
    52%
         Graduation rates
2022
2023 Year and race
2024
Figure 11: Percentage success rates by major field of study, 2022–2024
The graduation rate is determined by calculating the percentage of graduates relative to the total number of students enrolled in a given reporting year. Consequently, the graduation rate can increase if there is an increase in the number of graduates, a decrease in enrolment numbers, or a combination of both factors. In 2024 the DUT’s graduation rate was 24%, indicating that, out of the total enrolment of 34,495 students, 8,294 successfully completed their studies and graduated. This graduation rate has consistently surpassed the DHET standard of 22.5% since 2018. The challenges students faced in adapting to face-to-face learning following online or hybrid learning environments affected the graduation rate in 2023, resulting in an almost 5% decrease compared to the previous year. The number of graduates increased from 7,878 in 2023 to 8,294 in 2024, that constituted a 5.3% growth while enrolment grew by 5.9% for the same period. A persistent gender gap shows females outperforming males, with 61% of 2024 graduates being female and 39% male, a trend consistent since 2022, as shown in Figure 12.
70,0% 60,0% 50,0% 40,0% 30,0% 20,0% 10,0%
0,0%
59,9%
40,1%
60,1%
39,9%
61,03%
38,97%
   2022 2023 2024 YEAR
Female Male
Figure 12: Gender composition of gradates, 2022–2024
 42
DUT ANNUAL REPORT 2024
PERCENTAGE
African Coloured Indian White Other African Coloured Indian White Other African Coloured Indian White Other
Percentage
