
Page 44 - DUT Annual Report 2023
P. 44
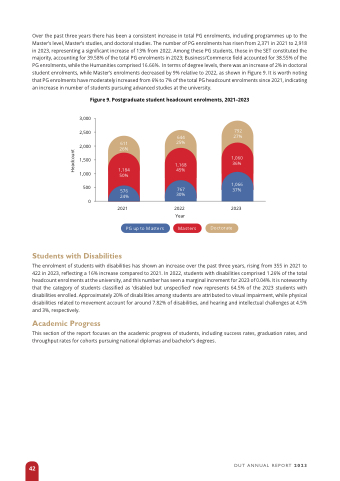
Over the past three years there has been a consistent increase in total PG enrolments, including programmes up to the Master’s level, Master’s studies, and doctoral studies. The number of PG enrolments has risen from 2,371 in 2021 to 2,918 in 2023, representing a significant increase of 13% from 2022. Among these PG students, those in the SET constituted the majority, accounting for 39.58% of the total PG enrolments in 2023; Business/Commerce field accounted for 38.55% of the PG enrolments, while the Humanities comprised 16.66%. In terms of degree levels, there was an increase of 2% in doctoral student enrolments, while Master’s enrolments decreased by 9% relative to 2022, as shown in Figure 9. It is worth noting that PG enrolments have moderately increased from 6% to 7% of the total PG headcount enrolments since 2021, indicating an increase in number of students pursuing advanced studies at the university.
Figure 9. Postgraduate student headcount enrolments, 2021–2023
3,000 2,500 2,000 1,500 1,000
500 0
792 644 27%
 611 25% 26%
1,168 1,184 45%
1,060 36%
1,066 37%
50%
576 24%
767 30%
2021 2022 2023 Year
   Students with Disabilities
PG up to Masters Masters
Doctorate
The enrolment of students with disabilities has shown an increase over the past three years, rising from 355 in 2021 to 422 in 2023, reflecting a 16% increase compared to 2021. In 2022, students with disabilities comprised 1.26% of the total headcount enrolments at the university, and this number has seen a marginal increment for 2023 of 0.04%. It is noteworthy that the category of students classified as ‘disabled but unspecified’ now represents 64.5% of the 2023 students with disabilities enrolled. Approximately 20% of disabilities among students are attributed to visual impairment, while physical disabilities related to movement account for around 7.82% of disabilities, and hearing and intellectual challenges at 4.5% and 3%, respectively.
Academic Progress
This section of the report focuses on the academic progress of students, including success rates, graduation rates, and throughput rates for cohorts pursuing national diplomas and bachelor’s degrees.
 42
DUT ANNUAL REPORT 2023
Headcount
