
Page 27 - Buku Exploring
P. 27
EXPLORING YOUR MULTIPLE INTELLIGENCES
Example:
D. Graph
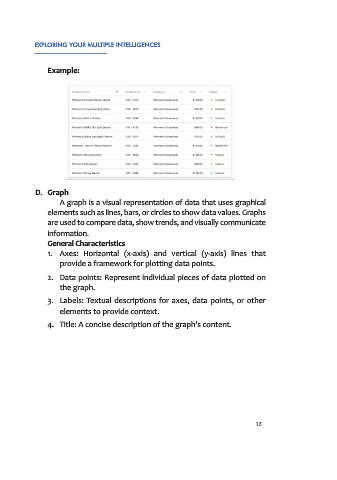
A graph is a visual representation of data that uses graphical
elements such as lines, bars, or circles to show data values. Graphs
are used to compare data, show trends, and visually communicate
information.
General Characteristics
1. Axes: Horizontal (x-axis) and vertical (y-axis) lines that
provide a framework for plotting data points.
2. Data points: Represent individual pieces of data plotted on
the graph.
3. Labels: Textual descriptions for axes, data points, or other
elements to provide context.
4. Title: A concise description of the graph’s content.
15