
Page 23 - Buku Exploring
P. 23
EXPLORING YOUR MULTIPLE INTELLIGENCES
UNIT 3
UNDERSTANDING, DIAGRAM,
FLOWCHART,
TABLE AND GRAPHS
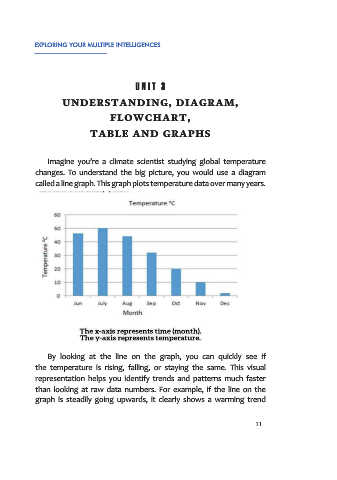
Imagine you’re a climate scientist studying global temperature
changes. To understand the big picture, you would use a diagram
called a line graph. This graph plots temperature data over many years.
By looking at the line on the graph, you can quickly see if
the temperature is rising, falling, or staying the same. This visual
representation helps you identify trends and patterns much faster
than looking at raw data numbers. For example, if the line on the
graph is steadily going upwards, it clearly shows a warming trend
11