
Page 22 - Banking Finance JANUARY 2017
P. 22
PRESS RELEASE
Allahabad Bank Highlights of Performance in Q-2 of FY 2016-17
Bank has made a Net Profit of Rs. 65.03 crore for the CASA stood at 38.50% of aggregate deposit.
quarter ended 30.09.2016. Provision Coverage Ratio improved to 47.60% as on
Gross NPA reduced to 12.28 % as on 30.09.2016 from 30.09.2016 as against 46.03% as on 30.06.2016.
12.33% as on 30.06.2016. Total business increased to Rs. 3,55,738 crore as on
Net NPA reduced to 8.59% as on 30.09.2016 from 8.69 30.09.2016 as against Rs. 3,40,101 crore as on
% as on 30.06.2016. 30.09.2015.
Axis Bank announces financial results for the quarter and half year
ended 30th September 2016
Asset Quality metrics rise, driven by Watch List: Other Income (including fee and trading profits)
The Bank's Gross NPA and Net NPA rose to 4.17% grew 24% YOY.
and 2.02% respectively in Q2 FY17.
Growth continues to be strong:
Watch List loans as on September 30, 2016 reduced Net Advances grew 18% YOY, led by Retail, which
by 32% quarter on quarter and stood at `13,789 grew 25% YOY.
crores.
Retail business continues to thrive:
The Watch List has reduced to 3.5% of customer CASA grew 19% YOY and constituted 45% of Total
assets in September 2016, from 5.4% in June 2016 Deposits as on 30th September 2016.
and 6.2% in March 2016.
Savings Account balances grew 20% YOY and stood
Profit after Taxes de-grows, stable operating perfor- at `107,839 crores as on 30th September 2016.
mance: Retail Advances accounted for 42% of Net Advances.
Net Profit for Q2FY17 & H1FY17 stood at Rs. 319 Retail Fee Income in Q2FY17 grew 17% YOY and con-
crores and Rs. 1,875 crores respectively and re- stitutes 43% of Total Fee Income.
ported a drop of 83% YOY and 52% YOY respectively.
The Bank's Capital Adequacy Ratio (CAR) remains
Operating Profit grew by 13% YOY while Net Inter- healthy. Under Basel III, Total CAR & Tier I CAR (includ-
est Income grew by 11% YOY. ing the net profit for H1FY17) stood at 15.20% and
Net Interest Margin for Q2 FY17 stood at 3.64%. 12.03% respectively.
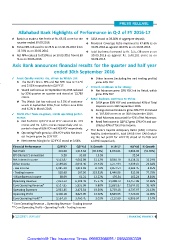
Financial Performance Q2FY17 Q2FY16 % Growth H1FY17 H1FY16 % Growth
Net Profit 319.08 1,915.64 (83.34%) 1,874.61 3,894.08 (51.86%)
EPS Diluted (`) annualised 5.28 31.83 15.59 32.54
Net Interest Income 4,513.87 4,062.09 11.12% 9,030.79 8,118.32 11.24%
Other Income 2,539.66 2,041.40 24.41% 5,277.94 4,339.67 21.62%
- Fee Income 1,935.29 1,812.69 6.76% 3,654.54 3,363.45 8.65%
- Trading Income 535.68 167.50 219.81% 1,446.86 813.98 77.75%
- Miscellaneous Income 68.69 61.21 12.22% 176.54 162.24 8.81%
Operating Revenue 7,053.53 6,103.49 15.57% 14,308.73 12,457.99 14.86%
Core Operating Revenue* 6,517.85 5,935.99 9.80% 12,861.87 11,644.01 10.46%
Operating Expenses 2,953.35 2,475.54 19.30% 5,739.18 4,737.97 21.13%
Operating Profit 4,100.18 3,627.95 13.02% 8,569.55 7,720.02 11.00%
Core Operating Profit** 3,564.50 3,460.45 3.01% 7,122.69 6,906.04 3.14%
* Core Operating Revenue = Operating Revenue - Trading Income
** Core Operating Profit = Operating Profit - Trading Income
22 | 2017 | JANUARY | BANKING FINANCE
Copyright@ The Insurance Times. 09883398055 / 09883380339