
Page 52 - Banking Finance MAY 2017
P. 52
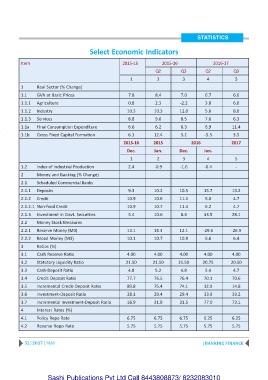
STATISTICS

                                         Select Economic Indicators


          Item                                         2015-16           2015-16                2016-17
                                                                      Q2         Q3         Q2           Q3
                                                           1           2          3          4           5

          1      Real Sector (% Change)
          1.1    GVA at Basic Prices                      7.8         8.4        7.0        6.7          6.6
          1.1.1  Agriculture                              0.8         2.3        -2.2       3.8          6.0
          1.1.2  Industry                                10.3        10.3        12.0       5.6          8.0
          1.1.3  Services                                 8.8         9.0        8.5        7.6          6.3

          1.1a   Final Consumption Expenditure            6.6         6.2        6.3        6.9         11.4
          1.1b   Gross Fixed Capital Formation            6.1        12.4        3.2        -5.3         3.5
                                                        2015-16      2015             2016              2017
                                                         Dec.        Jan.        Dec.       Jan.
                                                           1           2          3          4           5

          1.2    Index of Industrial Production           2.4         -0.9       -1.6       -0.4          -
          2      Money and Banking (% Change)
          2.1    Scheduled Commercial Banks
          2.1.1  Deposits                                 9.3        10.2        10.5       15.7        13.2
          2.1.2  Credit                                  10.9        10.6        11.1       6.0          4.7

          2.1.2.1 Non-food Credit                        10.9        10.7        11.3       6.2          4.7
          2.1.3  Investment in Govt. Securities           5.4        10.6        8.4        33.5        28.1
          2.2    Money Stock Measures
          2.2.1  Reserve Money (M0)                      13.1        14.3        12.1      -29.6        -26.9

          2.2.2  Broad Money (M3)                        10.1        10.7        10.9       6.6          6.4
          3      Ratios (%)
          3.1    Cash Reserve Ratio                      4.00        4.00        4.00       4.00        4.00
          3.2    Statutory Liquidity Ratio               21.50       21.50      21.50      20.75       20.50
          3.3    Cash-Deposit Ratio                       4.8         5.2        4.8        5.4          4.7
          3.4    Credit-Deposit Ratio                    77.7        76.5        76.4       70.1        70.6

          3.5    Incremental Credit-Deposit Ratio        89.8        75.4        74.1       12.9        14.8
          3.6    Investment-Deposit Ratio                28.1        29.4        29.4       33.9        33.2
          3.7    Incremental Investment-Deposit Ratio    16.9        31.8        31.5       77.0        73.1
          4      Interest Rates (%)

          4.1    Policy Repo Rate                        6.75        6.75        6.75       6.25        6.25
          4.2    Reverse Repo Rate                       5.75        5.75        5.75       5.75        5.75


            52 | 2017 | MAY                                                                | BANKING FINANCE


                      Sashi Publications Pvt Ltd Call 8443808873/ 8232083010