
Page 269 - Operations Strategy
P. 269
244 CHAPTER 7 • ImPRovEmEnT sTRATEgy
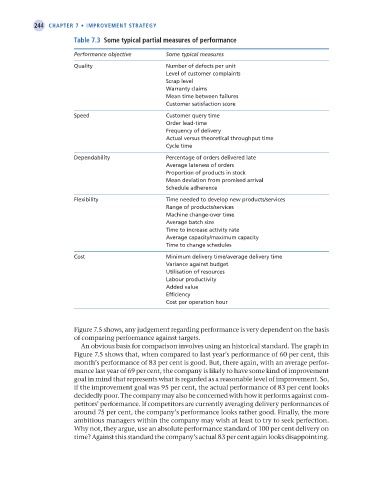
table 7.3 some typical partial measures of performance
Performance objective Some typical measures
Quality Number of defects per unit
Level of customer complaints
Scrap level
Warranty claims
Mean time between failures
Customer satisfaction score
Speed Customer query time
Order lead-time
Frequency of delivery
Actual versus theoretical throughput time
Cycle time
Dependability Percentage of orders delivered late
Average lateness of orders
Proportion of products in stock
Mean deviation from promised arrival
Schedule adherence
Flexibility Time needed to develop new products/services
Range of products/services
Machine change-over time
Average batch size
Time to increase activity rate
Average capacity/maximum capacity
Time to change schedules
Cost Minimum delivery time/average delivery time
Variance against budget
Utilisation of resources
Labour productivity
Added value
Efficiency
Cost per operation hour
Figure 7.5 shows, any judgement regarding performance is very dependent on the basis
of comparing performance against targets.
An obvious basis for comparison involves using an historical standard. The graph in
Figure 7.5 shows that, when compared to last year’s performance of 60 per cent, this
month’s performance of 83 per cent is good. But, there again, with an average perfor-
mance last year of 69 per cent, the company is likely to have some kind of improvement
goal in mind that represents what is regarded as a reasonable level of improvement. So,
if the improvement goal was 95 per cent, the actual performance of 83 per cent looks
decidedly poor. The company may also be concerned with how it performs against com-
petitors’ performance. If competitors are currently averaging delivery performances of
around 75 per cent, the company’s performance looks rather good. Finally, the more
ambitious managers within the company may wish at least to try to seek perfection.
Why not, they argue, use an absolute performance standard of 100 per cent delivery on
time? Against this standard the company’s actual 83 per cent again looks disappointing.
M07 Operations Strategy 62492.indd 244 02/03/2017 13:06