
Page 342 - Operations Strategy
P. 342
mAinTAining AlignmEnT ovER TimE 317
CAg over time
The operations strategy matrix to describe CAG’s changing issues over time allows us to see
how different resource and requirement issues become more or less important as the company
developed, and allows us to discuss the complexity, coherence and comprehensiveness of the
overall strategy. However, it does not fully capture the balancing act of reconciliation over time.
Figure 9.4 represents this dynamic process.
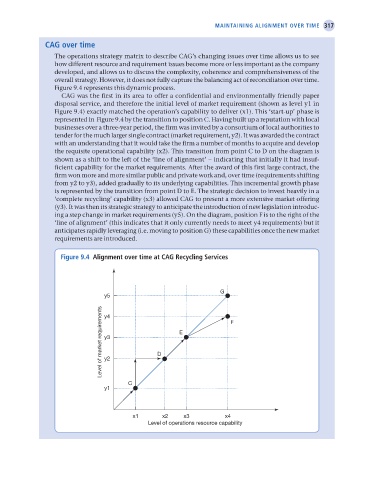
CAG was the first in its area to offer a confidential and environmentally friendly paper
disposal service, and therefore the initial level of market requirement (shown as level y1 in
Figure 9.4) exactly matched the operation’s capability to deliver (x1). This ‘start-up’ phase is
represented in Figure 9.4 by the transition to position C. Having built up a reputation with local
businesses over a three-year period, the firm was invited by a consortium of local authorities to
tender for the much larger single contract (market requirement, y2). It was awarded the contract
with an understanding that it would take the firm a number of months to acquire and develop
the requisite operational capability (x2). This transition from point C to D on the diagram is
shown as a shift to the left of the ‘line of alignment’ – indicating that initially it had insuf-
ficient capability for the market requirements. After the award of this first large contract, the
firm won more and more similar public and private work and, over time (requirements shifting
from y2 to y3), added gradually to its underlying capabilities. This incremental growth phase
is represented by the transition from point D to E. The strategic decision to invest heavily in a
‘complete recycling’ capability (x3) allowed CAG to present a more extensive market offering
(y3). It was then its strategic strategy to anticipate the introduction of new legislation introduc-
ing a step change in market requirements (y5). On the diagram, position F is to the right of the
‘line of alignment’ (this indicates that it only currently needs to meet y4 requirements) but it
anticipates rapidly leveraging (i.e. moving to position G) these capabilities once the new market
requirements are introduced.
Figure 9.4 Alignment over time at CAg Recycling services
G
y5
Level of market requirements y3 D E F
y4
y2
C
y1
x1 x2 x3 x4
Level of operations resource capability
M09 Operations Strategy 62492.indd 317 02/03/2017 13:27