
Page 414 - Operations Strategy
P. 414
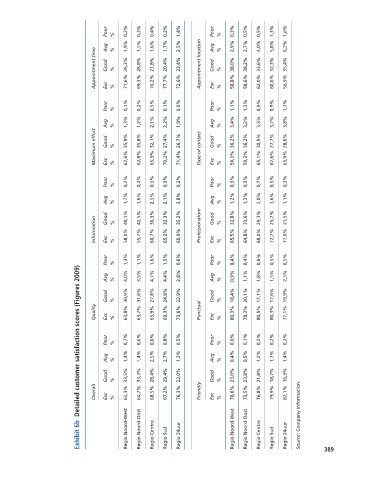
Poor   %  0,2%  0,3%  0,4%  0,2%  1,4%  Poor   %  0,3%  0,5%  0,5%  1,3%  1,6%
                                     Avg   %  1,9%  1,5%  1,6%  1,7%  2,5%  Avg   %  2,9%  2,7%  4,0%  5,8%  6,2%
                                 Appointment time  Good   Exc    %  %  26,3%  71,6%  28,8%  69,3%  21,8%  76,2%  20,4%  77,7%  23,4%  72,6%  Appointment location  Good   Exc    %  %  38,0%  58,8%  38,2%  58,6%  33,6%  62,0%  32,3%  60,6%  35,4%  56,9%


                                     Poor    %  0,1%  0,2%  0,5%  0,1%  0,0%  Poor    %  1,1%  1,3%  0,9%  0,9%  1,7%

                                     Avg   %  1,3%  1,2%  2,1%  2,2%  1,9%  Avg   %  3,4%  3,2%  3,5%  3,7%  3,8%
                                 Maximum effort  Good   Exc    %  %  35,9%  62,6%  35,8%  62,8%  32,1%  65,3%  27,4%  70,2%  26,7%  71,4%  Ease of contact  Good   Exc    %  %  36,2%  59,3%  36,2%  59,3%  30,5%  65,1%  27,7%  67,6%  28,6%  65,9%


                                     Poor    %  0,2%  0,2%  0,5%  0,3%  0,2%  Poor    %  0,5%  0,3%  0,7%  0,5%  0,3%


                                     Avg   %  1,7%  1,6%  2,5%  2,1%  3,8%  Avg   %  1,2%  1,3%  2,0%  1,6%  1,1%


                                 Information  Good   Exc    %  %  40,1%  58,0%  42,5%  55,7%  36,3%  60,7%  32,3%  65,2%  35,2%  60,9%  Professionalism  Good   Exc    %  %  32,8%  65,5%  33,6%  64,8%  29,3%  68,0%  25,2%  72,7%  21,5%  77,0%


                                     Poor    %  1,3%  1,1%  1,6%  1,5%  0,6%  Poor    %  0,4%  0,4%  0,6%  0,5%  0,5%
                             detailed customer satisfaction scores (Figures 2009)
                                     Avg   %  4,0%  3,5%  4,7%  4,4%  2,8%  Avg   %  0,9%  1,1%  1,8%  1,5%  2,5%

                                     Good   %  30,9%  31,6%  27,8%  24,8%  22,9%  Good   %  18,4%  20,1%  17,1%  17,6%  19,9%

                                 Quality  Exc    %  63,8%  63,7%  65,9%  69,3%  73,6%  Punctual  Exc    %  80,3%  78,3%  80,5%  80,3%  77,1%


                                     Poor    %  0,7%  0,6%  0,6%  0,8%  0,5%  Poor    %  0,0%  0,1%  0,2%  0,2%  0,2%


                                     Avg   %  1,4%  1,4%  2,5%  2,7%  1,2%  Avg   %  0,4%  0,5%  1,2%  1,1%  1,4%

                                     Good   %  33,5%  33,3%  28,4%  29,4%  22,0%  Good   %  23,0%  23,8%  21,8%  18,7%  16,3%

                                 Overall  Exc    %  64,3%  64,7%  68,5%  67,2%  76,3%  Friendly  Exc    %  76,6%  75,5%  76,8%  79,9%  82,1%


                             exhibit 6b    Regio Noord-West  Regio Noord-Oost  Regio Centre  Regio Sud  Regio 24uur  Regio Noord-West  Regio Noord-Oost  Regio Centre  Regio Sud  Regio 24uur  Source: Company information.  389


        Z03 Operations Strategy 62492.indd   389                                                      03/03/2017   16:04