
Page 121 - Libro 2
P. 121
7 — Intracranial Cerebrovascular Examination
101
A
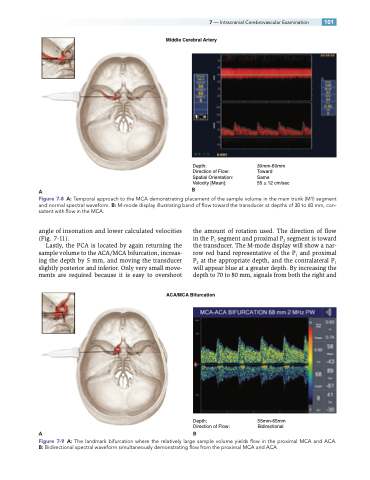
Middle Cerebral Artery
Figure 7-8 A: Temporal approach to the MCA demonstrating placement of the sample volume in the main trunk (M1) segment and normal spectral waveform. B: M-mode display illustrating band of flow toward the transducer at depths of 30 to 60 mm, con- sistent with flow in the MCA.
angle of insonation and lower calculated velocities (Fig. 7-11).
Lastly, the PCA is located by again returning the sample volume to the ACA/MCA bifurcation, increas- ing the depth by 5 mm, and moving the transducer slightly posterior and inferior. Only very small move- ments are required because it is easy to overshoot
the amount of rotation used. The direction of flow in the P1 segment and proximal P2 segment is toward the transducer. The M-mode display will show a nar- row red band representative of the P1 and proximal P2 at the appropriate depth, and the contralateral P1 will appear blue at a greater depth. By increasing the depth to 70 to 80 mm, signals from both the right and
Depth:
Direction of Flow: Spatial Orientation: Velocity [Mean]:
B
30mm-60mm Toward
Same
55 ± 12 cm/sec
ACA/MCA Bifurcation
Depth: 55mm-65mm Direction of Flow: Bidirectional
AB
Figure 7-9 A: The landmark bifurcation where the relatively large sample volume yields flow in the proximal MCA and ACA. B: Bidirectional spectral waveform simultaneously demonstrating flow from the proximal MCA and ACA
