
Page 197 - Libro 2
P. 197
11 — Ultrasound Assessment of Arterial Bypass Grafts
177
AB
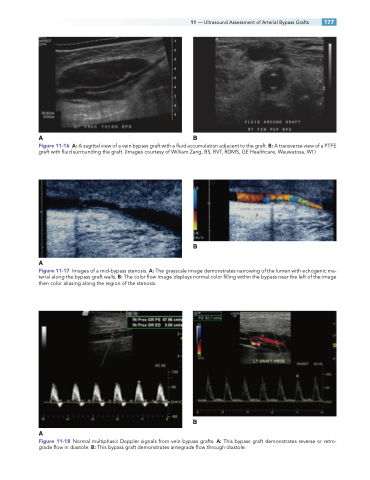
Figure 11-16 A: A sagittal view of a vein bypass graft with a fluid accumulation adjacent to the graft. B: A transverse view of a PTFE graft with fluid surrounding the graft. (Images courtesy of William Zang, BS, RVT, RDMS, GE Healthcare, Wauwatosa, WI.)
B
A
Figure 11-17 Images of a mid-bypass stenosis. A: The grayscale image demonstrates narrowing of the lumen with echogenic ma- terial along the bypass graft walls. B: The color flow image displays normal color filling within the bypass near the left of the image then color aliasing along the region of the stenosis.
B
A
Figure 11-18 Normal multiphasic Doppler signals from vein bypass grafts. A: This bypass graft demonstrates reverse or retro- grade flow in diastole. B: This bypass graft demonstrates antegrade flow through diastole.
